US Debt Crisis Tipping Point: What the Watchdog Warning to Congress Really Means
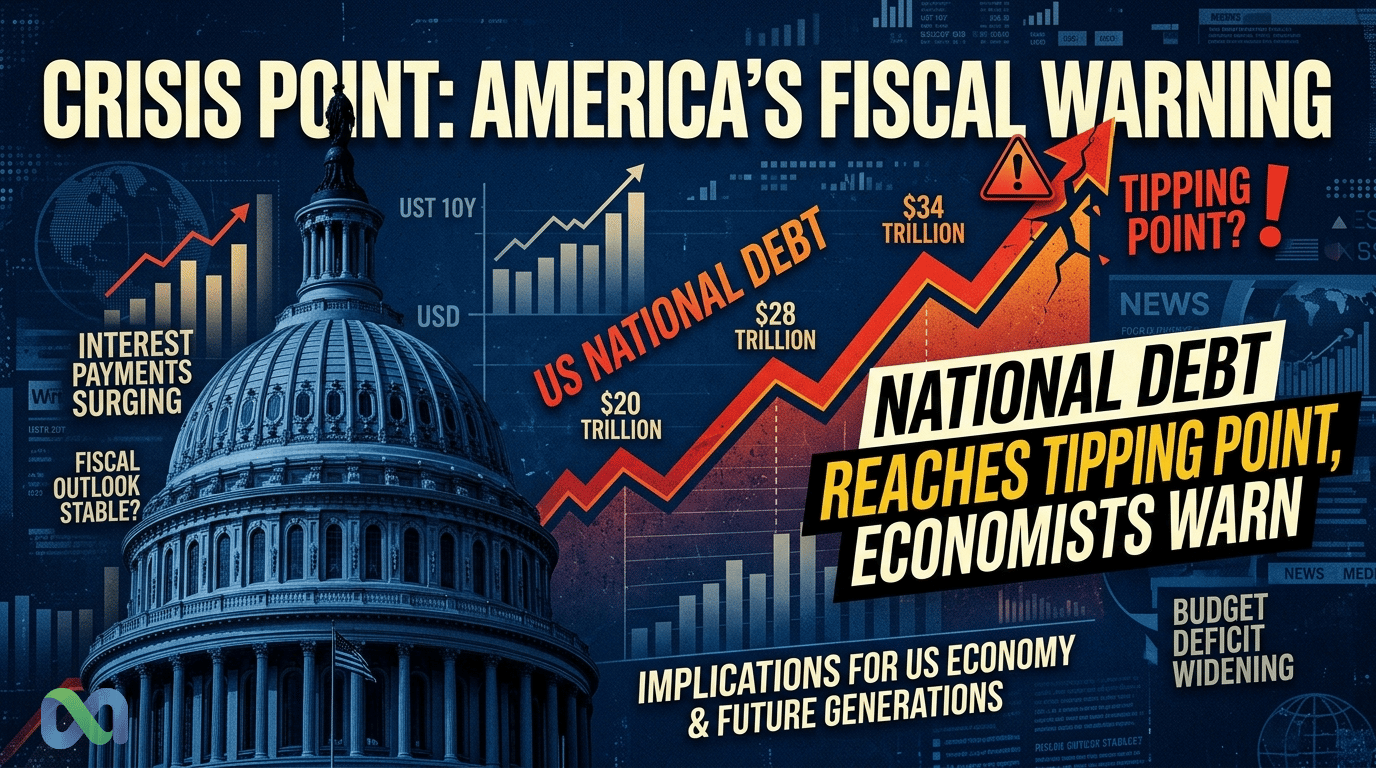
The US debt crisis tipping point is real, and closer than most people think. The US national debt has crossed $36 trillion. The government's own fiscal watchdog now warns Congress that the country is running out of time.
Both the Government Accountability Office (GAO) and the Congressional Budget Office (CBO) have issued clear warnings. Federal spending is rising faster than tax revenue. There is no easy fix. For investors, advisors, and prediction market traders, this creates both risk and real chance to profit.
This article explains what the US debt crisis tipping point warning means, what the data shows, and how prediction markets are pricing US fiscal risk right now.
Disclaimer: This article is for information only. It is not investment advice. All prediction market data reflects trader views, not guaranteed outcomes.
What Is the US Debt Tipping Point?
The term "tipping point" sounds alarming. But what does it mean in practical terms?
A debt tipping point happens when a country's debt grows faster than its economy can handle. At that stage, interest payments crowd out all other spending. The government must borrow just to pay interest on old debt. The cycle gets harder to stop each year.
The US has not reached that point yet. However, the trend lines are clear, and the US debt crisis tipping point is moving closer.
When Interest Costs Become Self-Reinforcing
Federal interest payments now exceed $1 trillion per year. That makes interest the fastest-growing item in the US budget. It now costs more than what the US spends on defense.
When interest eats a growing share of revenue, leaders face a very hard choice. They can cut popular programs like Social Security or Medicare. They can raise taxes sharply. Or they can keep borrowing and make the problem worse. Political pressures almost always push toward the third option.
The GAO calls this a "structural imbalance" between spending and revenue. It is not a short-term cash flow issue. It is a long-term question about US fiscal health and whether the country can stay on track.
The Debt-to-GDP Ratio That Matters
Economists do not agree on one "danger zone" for debt ratios. However, research from the IMF suggests that ratios above 90-100% of GDP start to slow economic growth.
The US debt-to-GDP ratio is close to 100% right now. The CBO projects it will pass the post-World War II record within a few years. That record was set in 1946 due to wartime spending. Today, the cause is peacetime structural deficits, not a one-time event.
Why CBO Projects Debt Exceeding Records by 2030
The CBO's Long-Term Budget Outlook shows that public debt will pass 100% of GDP by the early 2030s. By 2056, it could reach around 180% of GDP under current law.
These are not worst-case numbers. They assume no new recessions and no new programs. They reflect the built-in cost of programs already on the books, plus an aging population and rising interest costs. The US debt crisis tipping point scenario is baked into the baseline, not a fringe risk.
What the Watchdog Actually Said: GAO's Warning to Congress
The GAO puts out an annual report on fiscal health. The 2025 edition sent a clear message: the current US fiscal path is "unsustainable."
The GAO's Fiscal Sustainability Analysis
The GAO found that federal spending will far exceed revenue over the long term. Social Security and Medicare account for most of that gap. Healthcare costs keep rising as a share of GDP. Interest costs are compounding year after year.
The watchdog does not pick policy solutions; that is Congress's job. The GAO's role is to present facts and flag risks. On both counts, the 2025 report was direct and clear.
The Peter G. Peterson Foundation (PGPF), a nonpartisan group focused on fiscal policy, backs these findings. PGPF projects federal spending will rise from 23.3% of GDP in 2026 to 27.9% by 2056. Revenue is projected to stay roughly flat.
Why This Warning Is Different From Past Alerts
The US has issued fiscal warnings for decades. What makes 2025 different?
First, the scale. Debt has never been this high during peacetime. Interest rates have also risen sharply. Low rates in the 2010s let debt pile up without much pain. Higher rates now mean interest costs are rising faster than anyone budgeted for.
Second, the timeline has shrunk. What once looked like a distant problem now fits within a single budget cycle. The GAO is not warning about a crisis 30 years from now. The unsustainable path starts today.
Third, political gridlock has gotten worse. Congress has failed again and again to pass real budget reform. Debt ceiling fights in 2011, 2023, and since have grown more disruptive without fixing the root cause.
Congressional Response, Or Lack Thereof
Congress has not passed a real budget reform plan in living memory. Short-term fixes, continuing resolutions, debt ceiling pauses, spending caps, have replaced lasting solutions.
The GAO's warning falls on a Congress marked by thin margins, partisan fights, and election cycles that reward new spending and punish cuts. Budget hawks exist in both parties. However, they rarely form enough of a coalition to pass meaningful reform.
The Three Drivers Pushing the US Toward Fiscal Crisis
Three forces are driving US debt higher. Knowing them helps investors assess whether this risk is structural or temporary.
Aging Population: Social Security and Medicare Cost Explosion
The US is getting older. Baby boomers are retiring at a rate of about 10,000 per day. Each retiree shifts from paying into the system to drawing benefits from Social Security and Medicare.
Social Security alone faces a funding gap within the next decade. Medicare faces similar pressure. Together, these programs now account for roughly 50% of all federal spending, and that share is growing every year.
The math is simple and relentless. Fewer workers are supporting more retirees. The Social Security trust fund is expected to run out by the mid-2030s without new action. At that point, benefits would automatically be cut under current law, a political outcome neither party wants to own.
Healthcare Cost Escalation: From 6% to 8.1% of GDP
Healthcare is the single biggest long-term driver of federal spending growth. The CBO projects healthcare costs will rise from about 6% of GDP today to 8.1% of GDP by 2056.
This growth comes from several sources: an aging population needing more care, new medical technology, high drug costs, and a system that rewards volume over results.
Without structural reform, federal healthcare costs will keep rising no matter what enrollment looks like. This cost is baked into the budget, it cannot be easily reversed.
The Interest Rate Spiral: Borrowing to Pay Interest
Perhaps the most dangerous driver is also the least visible: compounding interest costs.
When the Federal Reserve raised rates to fight inflation, US borrowing costs jumped sharply. Old debt was rolled over at higher rates. New debt was issued at higher rates.
The result: federal interest payments rose from about $350 billion in 2020 to over $1 trillion by 2025. The CBO projects interest will stay the fastest-growing budget item for many years to come.
This creates a fiscal trap. More debt means more interest costs. More interest costs mean more borrowing. More borrowing means more debt. The cycle feeds itself, not because of new spending, but simply because of math. That is the core of the US debt crisis tipping point risk.
You can see current US debt data at US Treasury Fiscal Data and detailed CBO projections at the CBO's Long-Term Budget Outlook.
How Prediction Markets Price US Fiscal Risk
Traditional finance tracks fiscal risk through bond yields and credit default swaps. Prediction markets offer a different lens, one that turns policy risk into explicit probabilities.
Debt Ceiling Crisis Markets: What Traders Are Pricing
Every debt ceiling fight creates a tradeable event. Markets price the odds that the US hits the "X-date", the point when Treasury cannot pay all its bills without new borrowing authority, without a deal in place.
The 2011 standoff rattled markets even though default was avoided. The US credit rating was downgraded by S&P for the first time ever. In 2023, markets again priced high default risk before a last-minute deal was struck.
Prediction market odds on these events typically spike 60-90 days before an X-date, then collapse once a deal is reached. Traders who follow the legislative calendar and vote counts can position ahead of these moves.
US Credit Rating Downgrade: Agency History and Market Signals
All three major credit rating agencies have now downgraded or placed the US on negative outlook at various points.
- S&P downgraded the US from AAA to AA+ in 2011, citing fiscal trends and political dysfunction.
- Fitch downgraded the US to AA+ in 2023.
- Moody's has kept its top rating but placed the US on negative watch.
A Moody's downgrade would mean the US loses AAA status from all three major agencies. Prediction markets have tracked this risk at various probability levels depending on fiscal news flow.
Credit downgrades tend to cause short-term market swings, especially in Treasury yields and the dollar. They also raise long-term borrowing costs, feeding the interest spiral discussed above.
Prediction Markets as a Leading Fiscal Indicator
Prediction markets have shown an ability to price policy outcomes before they appear in mainstream news. On fiscal events, they reflect the views of traders who follow legislative dynamics closely.
For investors, prediction market data on debt ceiling deals, credit rating actions, and budget timelines can serve as an early warning system. When market-implied probabilities shift, they often do so before major news outlets catch up.
Macro Markets tracks real-time prediction market data on US fiscal events. Watching these markets gives a data-grounded view of risks that politicians are often unable, or unwilling, to name directly.
What This Means for Investors and Financial Advisors
The GAO's warning is not just political noise. It has real implications for portfolio allocation and risk management.
Portfolio Implications of Long-Term Fiscal Deterioration
A long-term fiscal decline, rising debt, higher interest costs, possible credit downgrades, creates several portfolio risks:
Rising long-term yields. As debt grows and fiscal trust erodes, markets may demand higher yields to hold Treasuries. This pushes bond prices down across the board.
Dollar weakening. Reserve currency status rests on confidence. Sustained fiscal problems erode that confidence. A weaker dollar cuts the buying power of dollar-based assets.
Equity market volatility. Higher rates raise the discount rate for stocks, pushing valuations lower. Rate-sensitive sectors, real estate, utilities, and high-growth tech, face the most pressure.
Asset Classes at Risk If Tipping Point Is Reached
Long-term Treasury bonds face the highest direct risk in a fiscal decline scenario. Rising yields cause large mark-to-market losses.
Bank stocks may face pressure if a fiscal crisis triggers a credit crunch or tighter lending. High-growth tech stocks face lower valuations from higher discount rates.
State and local bonds could suffer if federal transfers to states are cut as part of deficit reduction.
Opportunities in Fiscal Uncertainty
Not every asset suffers when fiscal risks rise. Some historically benefit:
Treasury Inflation-Protected Securities (TIPS) adjust their value for inflation. If fiscal problems lead to inflation, TIPS act as a direct hedge.
Gold has historically served as a store of value when currencies come under pressure. Sustained deficits and dollar weakness have tended to support gold prices over time.
Short-term bonds carry far less yield risk than long-dated bonds. Moving from long Treasuries to short-term bonds lowers interest rate exposure.
Real assets, commodities, roads, and real estate in tight markets, can hold value when a currency loses its worth.
Can Congress Actually Fix This? The Political Reality
The GAO has the data. The CBO has the projections. The question is whether Congress has the will to act on them.
Why Political Incentives Work Against Fiscal Discipline
Members of Congress face elections every two or six years. Fixing the deficit requires hard choices: cutting popular programs or raising taxes. Both are electoral liabilities.
The benefits of fiscal reform are long-term and spread out. The costs are immediate and visible. This creates a built-in bias toward delay.
No party has a strong reason to lead on deficit cuts. Both parties have run large deficits while in power. Fiscal discipline is easy to promise but hard to deliver.
What Budget Reform Would Actually Require
Real deficit reduction requires action on entitlements, defense, and revenue. No combination works without tackling at least two of the three.
Social Security reform options include raising the retirement age, adjusting benefits for higher earners, or raising payroll taxes. Medicare options include stronger drug price negotiation, shifting to value-based care, or means-testing benefits.
Revenue options include broadening the tax base, closing loopholes, or raising marginal rates. All face intense opposition from well-funded interest groups.
Any real reform needs votes from both parties, meaning each side must accept something it finds painful. That deal has been on the table for decades. It has not been made.
Historical Precedents: Countries That Fixed Their Fiscal Problems
Some countries have faced similar challenges and succeeded.
Canada in the 1990s cut federal spending over several years, reducing deficits and stabilizing debt. The process was hard but effective.
Sweden in the early 1990s reformed its pension system, moving from a fixed-benefit model to one tied to earnings and life expectancy. A cross-party commission designed the reform and built long-term stability into the system.
Both cases required sustained political consensus across multiple elections. Both succeeded because the alternative, fiscal collapse, was seen as more damaging than reform.
Whether the US can summon similar political will is an open question. Prediction markets and fiscal watchdogs are both signaling that the window for action is getting smaller.
FAQ: US Debt Crisis and Tipping Point
What is the US debt crisis tipping point?
The US debt crisis tipping point is the level at which federal debt grows faster than the economy can service it. Interest payments become self-reinforcing and crowd out all discretionary spending. The CBO projects debt could reach 180% of GDP by 2056 if current trends continue, far beyond the post-WWII record.
Which government watchdog warned Congress about the US debt crisis?
The Government Accountability Office (GAO) issues annual fiscal sustainability reports warning that the US fiscal path is "unsustainable." The Congressional Budget Office (CBO) also publishes long-term budget outlooks showing structural deficits. InvestmentNews reported on the most recent GAO warning, framing it for the financial advisory community.
How much is the US national debt in 2025?
The US national debt passed $36 trillion in 2025. This is roughly equal to the entire annual output of the US economy. The CBO projects the debt will keep rising and will pass the post-WWII record relative to GDP within a few years under current law.
What happens if the US debt becomes unsustainable?
If debt becomes unsustainable, interest payments crowd out all other spending. The Treasury may face higher borrowing costs as bond yields rise. Credit rating agencies may cut the US rating further. Dollar reserve currency status could come under threat over the long term. Prediction markets track the probability of specific near-term events like debt ceiling crises and credit downgrades.
Can Congress reduce the US national debt?
Reducing the debt requires either major spending cuts or significant tax increases, both politically difficult. But it has been done before. Canada in the 1990s and Sweden's pension reform show that sustained political will across multiple election cycles can produce lasting results. The US has not yet built that consensus.
What are prediction markets saying about US fiscal risk?
Prediction markets price the odds of specific US fiscal events: debt ceiling crises, credit downgrades, and budget deal timelines. These markets reflect the views of traders closely tracking legislative dynamics. Probabilities shift with news flow and can serve as an early warning system for investors monitoring US debt ceiling prediction market signals.
Conclusion
The GAO's warning is not political spin. The math behind the US debt crisis tipping point is real and increasingly hard to reverse without painful action.
Debt exceeds $36 trillion. Interest payments have crossed $1 trillion per year. Demographics are locked in. Healthcare costs will keep rising. The political system has consistently chosen short-term delay over long-term reform.
For investors and prediction market participants, this trajectory creates both risk and opportunity. Long-duration bonds, dollar assets, and rate-sensitive stocks face structural headwinds. Inflation-protected assets, short-duration bonds, real assets, and gold may benefit from sustained fiscal uncertainty.
Prediction markets give a real-time read on how traders price specific near-term events: debt ceiling standoffs, credit rating changes, and budget timelines. Tracking these signals provides data-driven insight into a risk that traditional financial media often undervalues.
Track real-time market probabilities on US debt ceiling events, credit rating outcomes, and fiscal policy at Macro Markets.