Price Discovery: How Prediction Markets Turn Information into Probabilities
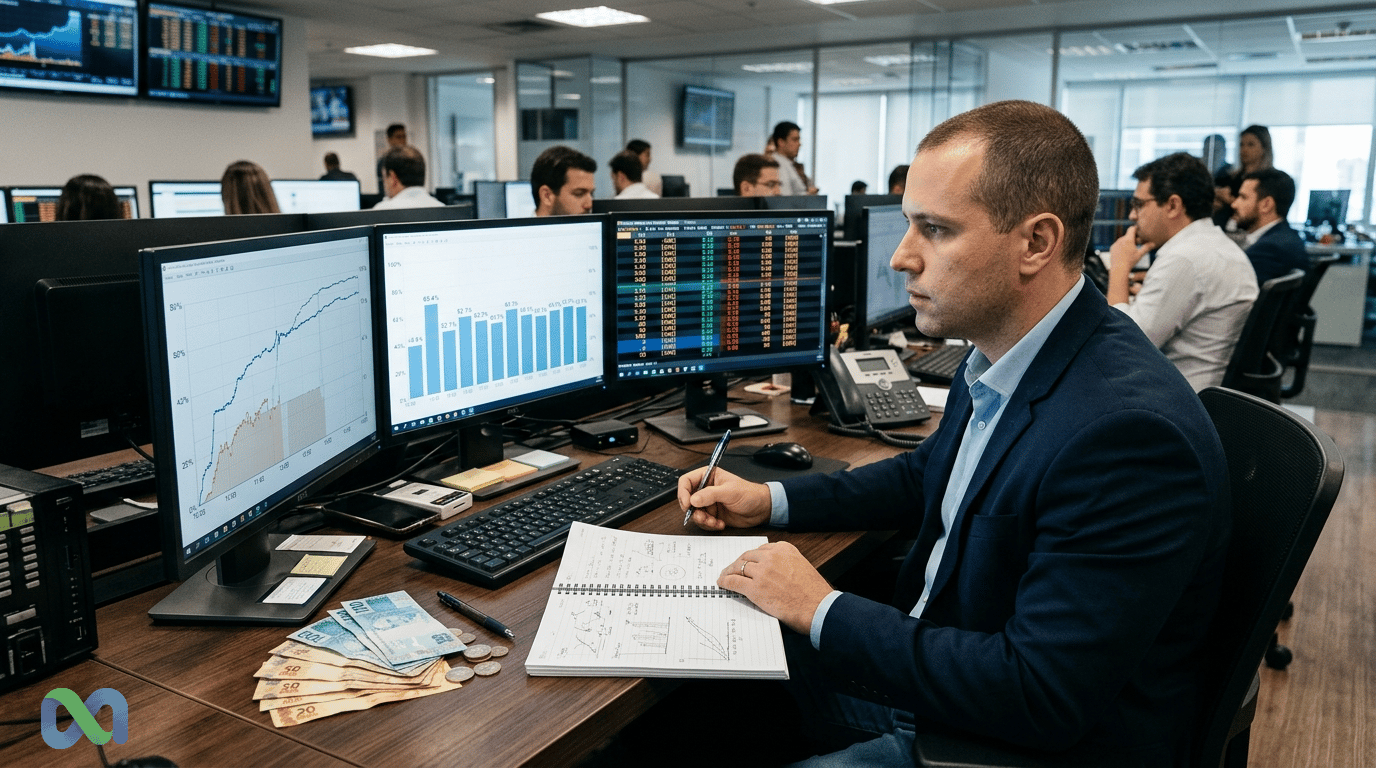
In prediction markets, every price change tells a story. It can reflect new information, available liquidity, trader conviction, or simply short-term noise. Price Discovery is the process that separates these signals and turns dispersed expectations into a tradable price.
The concept sounds technical, but it appears on every market page. If a contract about a COPOM decision trades near 0.63, many readers understand that as an implied probability close to 63%. That reading can be useful. However, it only makes sense when the market structure, spread, liquidity, and resolution rules support the signal.
In this guide, you will understand how Price Discovery works in prediction markets. You will also see the difference between market price and your own valuation, as well as the signals that help distinguish real information from noise. The goal is not to promise accuracy. It is to show how to interpret traded probabilities with more discipline.
What Is Price Discovery?
Price Discovery is the process through which buyers and sellers turn available information into a tradable price. In prediction markets, that price can work as the implied probability of an event, as long as there is enough liquidity, clear resolution rules, and low distortion from spreads or isolated orders.
In Portuguese, the closest term is “descoberta de preços.” It describes how the market arrives at a price from supply, demand, information, urgency, and risk. Instead of having a central authority saying what the price should be, participants reveal their expectations through orders and trades.
This dynamic is well known in traditional financial markets. CME Group describes Price Discovery as a central function of futures exchanges. Investopedia also separates Price Discovery from valuation. That difference matters even more in prediction markets because the price is often read as probability.
Price Discovery vs. Descoberta de Preços
In practice, both terms point to the same process. The difference is language. Traders, analysts, and global products use “Price Discovery.” Portuguese-language content usually translates it as “descoberta de preços.”
For Brazilian readers, it is worth keeping both terms. People researching the topic often use the English expression. Still, the explanation needs to be clear in Portuguese. Price Discovery is not a single formula. It is a continuous adjustment process.
Why the Term Matters in Prediction Markets
In prediction markets, price does not represent only monetary value. It can represent the probability of an event. If a contract pays 1 unit if an outcome happens, a price of 0.40 suggests the market is trading that outcome near 40%.
That reading is powerful, but it requires care. Fees, spreads, low depth, and resolution rules can pull the price away from a clean probability. Therefore, Price Discovery is useful when you read the market as an aggregated signal, not as a guarantee.
How Price Discovery Works in Prediction Markets
Price Discovery begins when participants observe information and decide to act. A trader may buy an outcome because they saw a new election poll. Another may sell because they think the market overreacted. A third may do nothing because the spread is wide.
Each decision affects the price directly or indirectly. The intensity of the effect depends on the mechanism used by the platform. In an order book, available orders show where buyers and sellers are willing to trade. In an AMM system, the price curve adjusts the value as new positions enter.
Price as Implied Probability
Imagine a market on the next COPOM decision. The “hold rates” contract trades at 0.58. In simplified terms, this suggests an implied probability close to 58% for that outcome.
Now imagine that a new communication from the Central Bank changes how analysts read the situation. More traders start buying the “hold” outcome. The price rises to 0.66. That move indicates that the market has started assigning a higher probability to the event.
The logic is simple. Price summarizes traded expectations. However, it does not explain by itself why the change happened. To interpret it well, you need to look at volume, history, spread, news, and resolution rules.
Orders, Trades, and Information Updates
Price Discovery does not happen only when someone publishes news. It happens when participants incorporate that news into the price. That incorporation can be fast in liquid markets and slow in shallow markets.
A large trade can move the price because it carries conviction. But it can also move the price because there is little liquidity. The same 10-percentage-point change can mean two very different things. In a deep market, it may be a strong signal. In an empty market, it may be only order impact.
That is why experienced traders do not look only at the last price. They observe the path. Did the price rise with growing volume? Did the spread tighten? Did other participants confirm the move? Does the history show stability or only an isolated spike?
Example: COPOM, Elections, and IBGE Data
Consider three Brazilian scenarios. In the first, a market on COPOM reacts after an official statement. In the second, an election market moves after a newly registered poll. In the third, an inflation market changes after data released by IBGE.
In all three cases, public information can alter expectations. Even so, the price only becomes a good signal when there is enough trading. If a few trades move the contract, Price Discovery is fragile. If many participants trade with tighter spreads, the signal tends to be more informative.
That is the central point. Price Discovery is not just “the price moved.” It is the process that explains whether the move has quality.
The Market Mechanisms That Shape Price Discovery
Market microstructure defines how information becomes price. Two markets can trade the same event and still produce different signals. This happens because each platform uses its own rules, liquidity, and mechanisms.
In prediction markets, the most common models involve order books, market makers, or combinations of both. Understanding these pieces helps readers know when a price deserves attention.
CLOB: Order Book, Bid, Ask, and Spread
CLOB means central limit order book. It is the order book used on many exchanges. In it, buyers post purchase prices, called bids. Sellers post sale prices, called asks. The distance between the two is the spread.
If the best buyer is willing to pay 0.61 and the best seller is willing to sell at 0.64, the spread is 3 points. The traded price may sit near that range. The smaller the spread, the easier it is to execute an order without distorting the price.
The order book also shows depth. If there are many orders near the current price, the market absorbs larger trades with less slippage. If there are few orders, even a small position can move the displayed probability.
AMM and LMSR: Algorithmic Liquidity
Some platforms use an Automated Market Maker, or AMM. In this model, an algorithm provides liquidity and adjusts the price as traders buy or sell outcomes. A well-known version in prediction markets is LMSR, linked to the idea of logarithmic scoring rules.
The AMM helps new markets have liquidity even without many participants. That matters because a market without a direct counterparty can stall. However, the AMM curve defines how much the price changes for each trade.
In other words, the AMM enables continuous trading. At the same time, it influences the shape of Price Discovery. If pool liquidity is limited, larger trades create more impact. If liquidity is greater, the price moves more smoothly.
Depth, Slippage, and Liquidity Providers
Depth is the amount of liquidity available near the current price. Slippage is the difference between the expected price and the actual execution price. Both concepts are essential for interpreting Price Discovery.
A market may show 62% on screen but execute your average order at 66%. That changes the economics of the position. It also shows that the visible price may not be as robust as it looks.
Liquidity providers reduce this problem when they place capital on both sides of the market. They help tighten spreads and stabilize execution. As a result, the price starts to better reflect the traded consensus.
Price Discovery vs. Valuation: What the Market Knows and What You Estimate
Price Discovery and valuation are not the same thing. Valuation is your estimate. Price Discovery is the price the market actually trades. The difference between the two can reveal opportunity, risk, or information you have not seen yet.
In prediction markets, valuation is usually the probability a trader assigns to an event. That probability can come from models, polls, history, qualitative analysis, or news reading. Then the trader compares their estimate with the market price.
Here is the difference in simple terms:
- Valuation: your own calculation. For example, you calculate 70% for “hold rates.”
- Price Discovery: the price the market accepted for trading. The contract may be near 58%.
- Divergence: the distance between your calculation and the price. Here, the difference is 12 points.
- Risk: the chance that your reading is incomplete. The market may have information you have not seen yet.
The Trader’s Own Model
A good personal model does not need to be complex. It needs to be explicit. Which sources did you use? What weight did you give to polls, speeches, economic data, or history? What would make you change your mind?
Without that map, the trader only reacts to price. With the map, they can compare their view with the market. That comparison is the beginning of a more disciplined decision.
The Market’s Aggregated Price
The aggregated price summarizes the actions of many participants. Some have better information. Others have only an opinion. Some trade from conviction. Others trade for hedging, liquidity, or risk management.
That is why the market price is not an absolute truth. It is a collective estimate with different weights. Even so, when there is liquidity and competition, it can condense information faster than isolated analyses.
When Divergences Create Opportunity or Risk
If you estimate 70% and the market trades 55%, it may look like an opportunity. But the right question is: why does this difference exist? Maybe the market is slow. Maybe you found underpriced information. Or maybe the market knows something your model did not capture.
Discipline means treating divergence as a hypothesis, not as certainty. The price helps frame the question. It does not deliver the final answer.
What Can Distort Price Discovery
Not every price move deserves the same confidence. In prediction markets, some distortions appear frequently. They do not invalidate the concept of Price Discovery, but they reduce the quality of the signal.
Low Liquidity
Low liquidity means limited ability to trade without moving the price. In a shallow market, a single order can change the displayed probability. That move may look like new information, but it may only be a lack of depth.
The first question should be simple: how much volume exists? Then look at whether the market has recent activity. A price that has been static for days may be outdated.
Wide Spreads
A wide spread indicates disagreement or lack of liquidity between buyers and sellers. If the bid is at 45% and the ask is at 60%, the “fair price” is uncertain. Any point-in-time reading can mislead.
In that case, the market communicates more uncertainty than precision. The spread becomes part of the message. The wider the range, the lower the confidence in the single number displayed.
Temporary Manipulation or Isolated Orders
Shallow markets can experience temporary moves. A participant may buy aggressively and push the price up for a few minutes. Without confirmation from volume and continuity, that move can reverse quickly.
This does not mean every sharp move is manipulation. It only means Price Discovery requires context. History, volume, and the reaction of other participants help separate signal from noise.
Ambiguous Event Resolution
Ambiguous resolution rules hurt Price Discovery. If traders do not agree on what counts as a valid outcome, they trade different risks. The price stops representing only the probability of the event and starts including interpretation risk.
That is why serious markets need clear criteria. Official sources, dates, time zones, and resolution conditions should appear before trading. Without that, the price can reflect confusion, not information.
How to Read Price Discovery on Platforms Like Polymarket, Kalshi, and Macro Markets
Prediction market and event contract platforms let users trade outcomes of future events. Polymarket and Kalshi are well-known examples in the global sector. Macro Markets focuses the experience in Portuguese and on topics relevant to Brazilian and Latin American traders.
The useful comparison is not “which price is right.” The better question is: what information does each market page provide to evaluate the price? The more transparent the page, the easier it is to understand the quality of Price Discovery.
What to Observe on a Market Page
Start with the market statement. It should say exactly which event will be resolved. Then read the rules. They need to explain the resolution source, deadline, and validation criteria.
Next, observe the current price. Also look at history, volume, liquidity, and spread when those data are available. If there is chat or recent activity, use it as context, not as proof.
Volume, Liquidity, and Price History
Volume shows interest, but it does not solve everything. A market can have old volume and little current liquidity. That is why recent activity matters.
Price history helps you understand whether the move was gradual or abrupt. A gradual adjustment after new information tends to be healthier. An isolated jump, without continuous volume, requires more caution.
Current liquidity answers another question: can I trade near the displayed price? If the answer is no, the on-screen price has limited usefulness.
Why Platform Structure Matters
Structure defines how trades move prices. In a CLOB, you see intentions in the order book. In an AMM, you see the curve react to trades. In hybrid models, both forces can coexist.
This difference does not automatically make one model better. It only changes the reading. A trader should know whether they are looking at orders from other participants, an algorithmic curve, or both.
Practical Checklist: When Is a Price a Good Signal?
Use this checklist before interpreting a price as a reliable probability. It does not eliminate risk, but it reduces rushed readings.
Use the list below as a practical rule:
- Volume: stronger signal when there is recent trading. More noise when volume is old.
- Spread: stronger signal when bid and ask are close. More noise when the range is wide.
- Depth: stronger signal when there are several orders near the price. More noise when liquidity is thin.
- History: stronger signal when the move is gradual. More noise when there is an isolated spike.
- News: stronger signal when the source is clear. More noise when there is only rumor.
- Resolution: stronger signal when the rule is objective. More noise when the market statement is ambiguous.
- Execution: stronger signal when slippage is low. More noise when a small order moves the price a lot.
Signs of a Healthy Market
A healthy market usually has a smaller spread, recent activity, and clear rules. It also shows a coherent reaction to new information. If a relevant election poll comes out, the move should appear with volume and continuity.
Another good sign is temporal consistency. A price that holds after trading by several participants tends to be more informative than an unconfirmed spike.
Noise Alerts
Be skeptical of very strong moves in shallow markets. Also treat displayed prices without executable liquidity with caution. A number on screen may look precise, but real execution tells a different story.
Rumors also deserve care. If the news does not have a verifiable source, the price may reflect collective anxiety. In that case, Price Discovery still happens, but the signal is weaker.
Questions Before Trading
Before trading, ask four questions. Is the event clearly defined? Does the current price have liquidity behind it? Does the recent move have a verifiable explanation? Does my own estimate consider information that the market may already have incorporated?
If you cannot answer, you may be looking at noise. In that case, waiting can be a rational decision.
Price Discovery in Plain Language
Price Discovery can be read as a simple question: what price does the market accept right now? The answer changes when new data arrives. It also changes when liquidity is missing. That is why the number alone is not enough.
Think of a street market. A seller asks for one price. A buyer offers another. When both close a deal, a real price emerges. In a prediction market, something similar happens. The difference is that the traded product is a future outcome.
If more people want to buy “yes,” the price tends to rise. If more people want to sell, the price tends to fall. This back and forth shows how the market reads the event at that moment.
But the price is not destiny. It is a signal. A contract at 60% can still lose. A contract at 30% can still win. Price Discovery helps measure what the market thinks. It does not eliminate surprise.
Use three simple steps. First, read the market rule. Second, look at the price and the spread. Third, check volume and history. If all three points look clear, the signal tends to be better.
If one of them fails, reduce confidence. A market without clear rules creates doubt. A market without liquidity can move too much. A market without history can hide noise.
This simple reading avoids two mistakes. The first is treating price as certainty. The second is ignoring price when it disagrees with your view. Good traders choose the middle path. They use Price Discovery as a map, but still check the road.
FAQ About Price Discovery
What Is Price Discovery?
Price Discovery is the process in which buyers and sellers turn information into a tradable price. In prediction markets, that price can indicate implied probability when the contract, liquidity, and rules allow that reading.
Is Price Discovery the Same as Forecasting?
No. Price Discovery is the process of price formation. Forecasting is the interpretation of that price or the estimate of a participant. The market can signal 60%, but that does not guarantee the event will happen.
Is Prediction Market Price Always Probability?
Not always in a clean way. In well-defined binary contracts, the price can be read as an approximate probability. However, fees, spread, slippage, low liquidity, and resolution risk can distort that reading.
Why Does Liquidity Matter for Price Discovery?
Liquidity matters because it reduces the impact of isolated orders. It also tends to reduce spreads and improve execution. With more liquidity, the price usually better reflects the traded consensus.
Does Price Discovery Eliminate Uncertainty?
No. It organizes information, but it does not remove uncertainty. Markets can be wrong, overreact, or incorporate incomplete data. That is why market probabilities should be viewed as signals, not promises.
Conclusion: Price Is a Signal, Not Certainty
Price Discovery is the engine that turns dispersed information into a tradable price. In prediction markets, that price can become a probability reading. However, the quality of that reading depends on liquidity, spread, depth, market mechanism, and resolution rules.
The best way to use Price Discovery is to compare the market signal with your own analysis. When the two diverge, investigate. Maybe there is an opportunity. Maybe there is a risk you have not seen yet.
The next step is to study the microstructure behind these signals. Concepts such as CLOB, AMM, LMSR, liquidity, slippage, and event resolution explain why a price changes. At Macro Markets, this vocabulary helps Brazilian traders read prediction markets with more precision and less noise.