Data Center Copper Demand 2040: 127% Growth Sets Up a Mine Supply Crisis
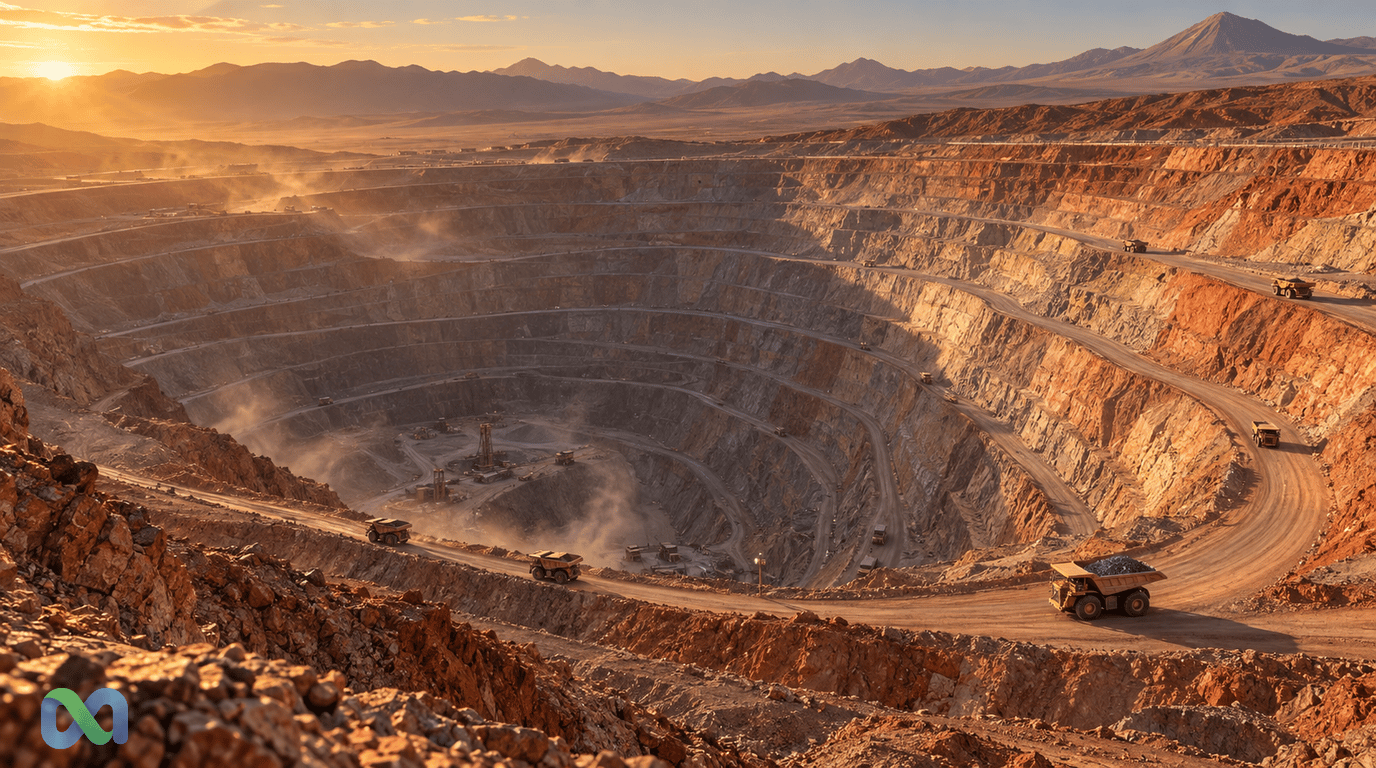
The data center copper demand 2040 outlook from S&P Global is stark. Annual data center copper use will rise 127% by 2040. The problem is that a new copper mine takes 17.5 years to build.
That supply-demand gap is the central tension. AI data centers open in 18-24 months. Copper mines take nearly two decades. The math does not work in supply's favor.
This article covers the S&P Global and IEA forecasts, the mine development bottleneck, and what the supply gap means for copper prices and investors.
This is for informational purposes only and does not constitute financial advice. All forecasts are third-party projections.
The 127% Number: What S&P Global's Data Actually Shows
S&P Global forecasts data center copper demand rising from 1.1 million metric tons in 2025 to 2.5 million metric tons by 2040, a 127% increase. This comes from the firm's Copper in the Age of AI report. It is one of the most cited analyses of the copper demand shift driven by AI.
AI training centers account for 58% of that data center copper demand by 2030. But that figure is only part of the full story.
Inside the Facility: Why Racks Use So Much Copper
A standard server rack uses 5-10 kilowatts. An AI training rack uses 130-300 kilowatts. That is 20 to 30 times more power in the same space.
Copper moves throughout high-power data center systems. It runs through busbars and wiring for power flow, heat exchangers and cooling loops, servers and switches, and backup power systems. As rack density rises, copper use rises with it. Facilities are also getting larger. Hyperscale campuses now cover hundreds of acres.
The Sensitivity Range: 1.7 Mt to 2.7 Mt
S&P does not treat 2.5 Mt as a certainty. The firm models a range of 1.7 to 2.7 million metric tons by 2040. The key factor is grid supply.
If power limits slow data center growth, demand lands near 1.7 Mt. If grids expand faster, demand could reach 2.7 Mt. This 1.0 Mt range is 35% of today's global mine output. That is why copper price forecasts carry real uncertainty.
Electricity Demand Adds More Copper Beyond the Facility
The 127% figure only covers copper inside data centers. Most of the copper needed to run AI systems sits outside the facility, in the power grid.
IEA: Data Center Power Use Doubles by 2030
The IEA projects global data center power use rising from 485 TWh in 2025 to about 950 TWh by 2030. That doubling happens in five years.
Copper is needed at every delivery stage. That means generation plants, power lines, substations, and local delivery networks. S&P Global estimates that power grid copper for data centers will add about 1.0 million metric tons per year by 2040. Therefore, the real copper impact of the AI boom is roughly double the headline 127% figure.
Grid Spending Tops $7.5 Trillion
Global grid investment will exceed $7.5 trillion through 2040. Much of this is for renewable energy and grid upgrades. Data centers add another demand source on top of that.
Hyperscale operators are also building private transmission lines and substations. Each one uses copper. These are not small projects.
The 17.5-Year Mine Problem: Why Supply Cannot Keep Up
Demand is rising fast. Supply cannot match it. The reason is simple: copper mines take a long time to build.
A new copper mine takes about 17.5 years from discovery to first output. This covers exploration, resource testing, engineering, permits, financing, and construction. None of these steps can be skipped.
Only 17 of 263 Discoveries Reached Construction
S&P Global tracks 263 major copper finds made since 1990. Only 17 have reached construction or near-production stage. That is a 6.5% rate over 35 years.
The other 246 stalled. The barriers are well-documented. Grade was too low for development at current copper prices. Sites were too remote, with no roads or ports. Permit processes alone took 5-10 years. Projects needed $3-10 billion in financing. Ore was too complex to process cheaply.
Each barrier takes years to resolve. Permit timelines in Chile and Peru have grown longer due to social and environmental reviews.
The resource definition pipeline is the single biggest constraint, according to Crux Investor's analysis of the S&P data. Most finds stall before they complete a full feasibility study.
18-24 Months vs. 17.5 Years
This is the core tension. AI data centers are built fast. Copper mines are not.
A hyperscale data center goes from planning to operation in 18-24 months. Large operators, Microsoft, Google, Amazon, deploy gigawatts of capacity on this timeline. They use standard modular designs that scale quickly.
A copper mine cannot compress its timeline. Geology takes the time it takes. Resource testing requires enough drilling to define the ore body. Permit reviews run on government schedules, not company ones.
So demand can double in five years. Supply takes 20 years to respond.
The 25% Supply Gap by 2035
The IEA's Stated Policies Scenario uses only announced projects. Under that view, announced copper projects meet roughly 75% of 2035 copper needs. The 25% gap is copper the market will need but cannot get from the current pipeline.
No project announced today can close that gap. The lead time is simply too long.
Investment Outlook: Which Projects Can Help
Not all 263 finds are stuck. Some have specific traits that speed up the path to production.
What Separates Projects That Advance
Proximity to infrastructure matters most after grade. A deposit near existing roads, power, and ports avoids years of permit work for new access routes.
Restart projects are the fastest path. These are old mines brought back into service. They often have existing permits, known geology, and usable processing sites. A restart can reach output in 3-5 years, not 15-17.
Sustained drilling capital is the third factor. Projects with steady drilling budgets advance. Those tied to market cycles stall when copper prices dip. Consistent drilling is how resources move from early-stage to the point where lenders will finance production.
S&P Global's >7 Mt Shortfall
S&P Global's January 2026 update found that AI and defense demand alone widen the supply gap by 24% vs. prior forecasts. The gap reaches more than 7 million metric tons by 2040. See the full S&P Global update for details.
That figure assumes announced projects proceed on schedule. In practice, many face delays. The real gap is likely larger.
For mining investors, the 7 Mt figure sets the scale of the need. Projects that can reach production before 2040 are well placed in a supply-short market.
Total Copper Demand: AI Adds to a Market Already Under Pressure
The data center story sits within a broader demand trend. Global copper demand was heading toward a shortfall before AI became a major factor.
From 28 Mt to 42 Mt
Global copper demand is about 28 million metric tons in 2025. S&P projects this rises to 42 Mt by 2040, a 50% increase from base demand. The main drivers are EVs (each using 3-4x the copper of a standard car), clean energy grid upgrades, and construction growth in Asia and Africa. AI and defense add roughly 4 million metric tons above that base path.
| Source | 2025 | 2040 | Change |
|---|---|---|---|
| Base demand | 28 Mt | 38 Mt | +10 Mt |
| Data centers (direct) | 1.1 Mt | 2.5 Mt | +1.4 Mt |
| Grid for data centers | , | ~1.0 Mt | +1.0 Mt |
| AI + Defense | , | +4 Mt | +4 Mt |
| Total | ~28 Mt | ~42 Mt | +14 Mt |
Based on S&P Global (2026). Figures are estimates.
The 24% Wider Supply Gap
S&P Global's 2026 analysis found that adding AI and defense demand widens the total supply gap by 24%. The gap grows because mine output cannot ramp fast enough.
Under the S&P base case, the world needs more than 7 million metric tons of copper by 2040 that current projects cannot supply. This is not a prediction of shortage. It is a forecast of sustained price pressure and the conditions that make new mine projects viable.
Copper Prices and Prediction Market Signals
Structural demand growth against constrained supply creates price pressure. But structural does not mean certain. That uncertainty is where prediction markets add value.
How the Demand Thesis Moves Price Scenarios
Copper prices respond to the cost of the next unit of supply. As demand climbs, prices must rise to justify higher-cost deposits.
Given the 17.5-year mine timeline, supply cannot respond quickly even when prices rise. This creates sustained upward price pressure through the 2030s. Data center demand and general grid growth compete for the same constrained mine output.
For live copper pricing and market context, see BBC Business News. Several variables move the odds of copper reaching $5/lb or $6/lb by 2030. These include how fast grids expand, permit timelines in Chile and Peru, EV adoption in China and Europe, and financing access for new mines.
LatAm Mining Drives the Supply Response
Chile and Peru together produce about 40% of global copper. Brazil holds large untapped deposits, especially in the Carajás mineral zone. These three countries hold the supply response the market needs.
Permit conditions and political trends in LatAm will directly shape global copper supply through 2040. Macro Markets events that cover LatAm economic and political outcomes carry embedded copper exposure. This link is easy to miss when viewing copper from a pure commodity angle.
Chile produced about 5.5 million metric tons of refined copper in 2024. Peru produced about 3 million metric tons of copper annually. Both countries are working through permitting delays on major expansion projects. The pace of those approvals will be a key swing factor in the global copper balance through the 2030s.
FAQ: Data Center Copper Demand 2040
How much will data center copper demand grow by 2040?
S&P Global forecasts a 127% increase: from 1.1 million metric tons in 2025 to 2.5 Mt by 2040. AI training drives 58% of that demand by 2030. The range is 1.7 to 2.7 Mt depending on grid constraints.
Why do AI data centers use so much copper?
AI training racks use 130-300 kilowatts each. That is 20-30 times more power than a standard rack. Copper is used in power systems, cooling, IT hardware, and grid connections. Higher power use means more copper.
How long does it take to build a new copper mine?
About 17.5 years from discovery to first output. This covers exploration, ore testing, engineering, permits, financing, and construction. Only 17 of 263 major finds since 1990 have reached production.
What is the copper supply gap by 2035?
Under the IEA's Stated Policies Scenario, announced projects meet roughly 75% of 2035 needs. S&P Global puts the full 2040 gap at more than 7 Mt when AI and defense demand are added.
Will copper prices rise because of data centers?
The math supports sustained price pressure. Demand rises 127% from data centers by 2040. Supply runs on a 17-year response clock. These two facts create upward pressure on copper prices through the 2030s.
The Bottom Line
Data center copper demand growth is data-backed and structural. Three facts from S&P Global's 2026 analysis frame the investment case. Direct data center demand rises 127% by 2040. A 25% supply gap opens by 2035. A 7+ Mt shortfall follows by 2040.
The speed gap between AI data center builds (18-24 months) and copper mine development (17.5 years) is not a short-term issue. It is a feature of the market through the mid-2030s.
For prediction market traders and commodity investors, the copper supply story creates clear questions with real probability signals. Follow copper price markets on Macro Markets to track how the market is pricing the supply crunch in real time.