


2026 World Cup Winner Odds: Historical Prices Explained
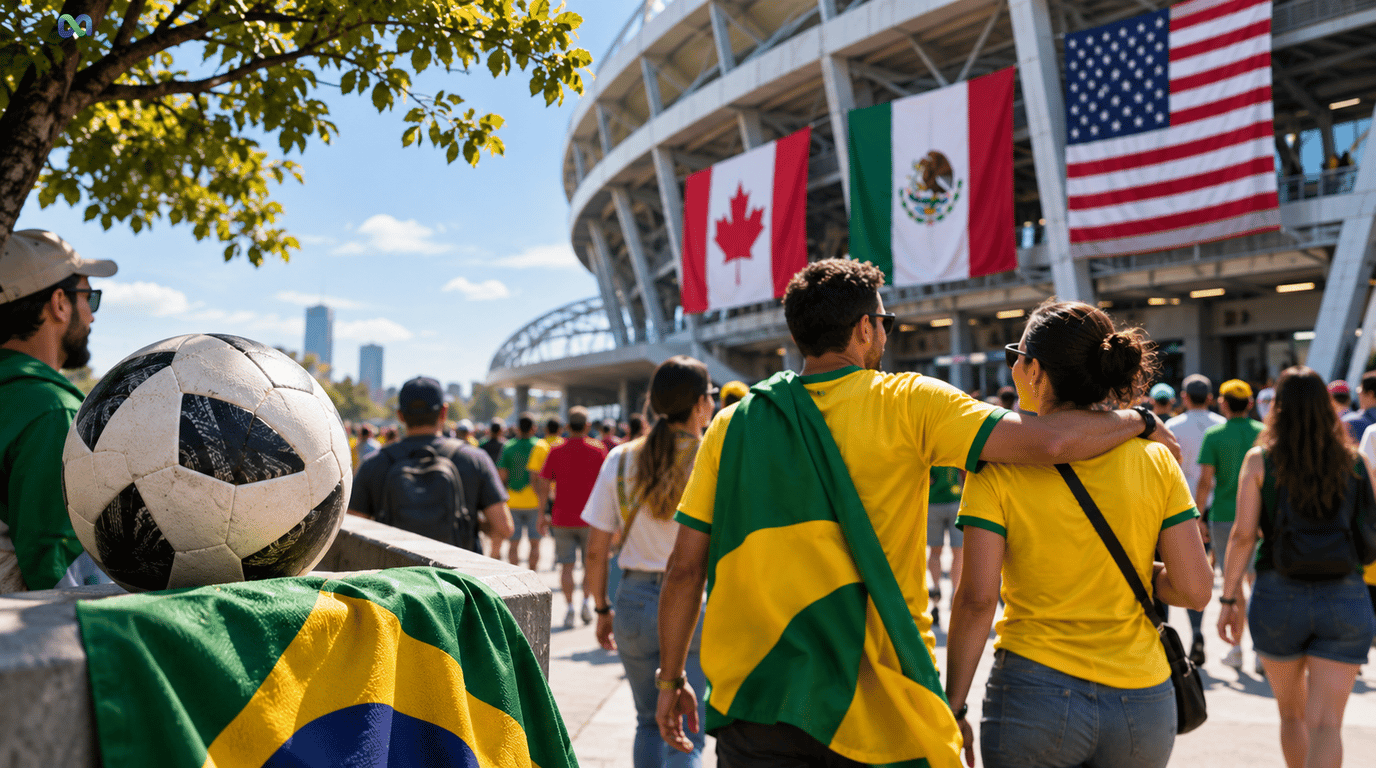
The 2026 World Cup is over: Spain beat Argentina 1–0 after extra time in the final on July 19, 2026. The 2026 World Cup winner odds below are historical prices, not an open forecast or current opportunity to trade the tournament winner. This guide compares the pre-tournament favorites and explains how odds, implied probability and the eventual result differ.
Spain was the shortest-priced team in the published preview used here, ahead of France and England. Brazil and Argentina had the same quoted price. Those prices described expectations before the competition; they did not guarantee an outcome. FIFA's official final report confirms Spain's victory.
Reviewed November 9, 2026. The historical comparison keeps the source and its publication context visible. It does not reconstruct every bookmaker or prediction-market price during the tournament.
Historical 2026 World Cup winner odds: the favorites
The table uses BetMGM quotes reported in AP's pre-tournament World Cup preview, republished by FOX Sports. The FOX Sports version of that preview displays an update of June 2, 2026. This is the publication date shown by the source, not a verified time stamp for each individual quote.
| Team | Historical American odds | Implied probability before margin adjustment |
|---|---|---|
| Spain | +450 | 18.18% |
| France | +550 | 15.38% |
| England | +650 | 13.33% |
| Brazil | +800 | 11.11% |
| Argentina | +800 | 11.11% |
The percentages are calculated from the quoted odds, rounded to two decimal places. The shortlist is not the complete field, and the percentages have not been adjusted for bookmaker margin. They are not verified historical Macro Markets prices.
This answers the comparison directly: Brazil's quoted chance was lower than France's and England's in this particular preview. Another date, operator or contract could have shown a different relationship. A useful historical comparison therefore starts with the source and date, rather than treating one price as the tournament's permanent consensus.
A dated quote is more useful for comparison than an unattributed range. Keep recorded prices separate from analytical estimates, and show the calculation used to convert odds into probability.
What did Brazil's quoted odds mean?
At +800, the implied probability is 100 divided by 900, or about 11.11%, before adjusting for margin. That is a price-based estimate from the preview. It is not Brazil's actual chance measured independently of the market, and it is not a live quote today.
A favorite can still be more likely to lose a tournament than win it. Even Spain's shorter +450 price implied less than a one-in-five chance before margin adjustment. The combined field contained many alternative outcomes.
Brazil's case also illustrates why supporting a team and estimating its chances are different activities. A price can reflect talent, squad availability, recent form, the draw and public demand. A famous shirt or a memorable past title does not settle the next match.
For the wider Brazil context, see our Brazil World Cup guide. Read any archived forecast there with its own date and source. Comparing an early forecast with a later price without marking the dates can create a false impression of disagreement.
How to convert World Cup odds into probability
Three formats can describe the same underlying quote:
| Format | Example | Implied probability formula |
|---|---|---|
| Positive American odds | +800 | 100 / (800 + 100) |
| Decimal odds | 9.00 | 1 / 9.00 |
| Fractional odds | 8/1 | 1 / (8 + 1) |
Each example implies about 11.11%. These are arithmetic conversions, before fees or bookmaker margin. Decimal odds include the returned stake in the total payout; fractional odds express the potential profit relative to the stake.
For negative American odds, use the absolute value divided by that value plus 100. For example, hypothetical odds of −150 imply 150 / 250, or 60%. That example explains the formula; it is not a historical World Cup quote.
Why the full board can total more than 100%
Bookmakers can build a margin into their prices. Add the implied probabilities for every mutually exclusive winner and the total may exceed 100%. That excess is called overround. Looking at only five teams cannot establish the margin on a complete tournament board.
One simple comparison method divides each implied probability by the sum for the entire field. That produces a proportional normalization. It is a modeling choice, not proof of a team's true chance, and it requires a complete set of quotes from the same source and moment.
Why a market price is not always an executable probability
On a prediction exchange, a contract paying one unit if an outcome occurs can be discussed in probability terms. A price of 0.16 is often read as roughly 16%, before trading costs and market frictions. The amount you can actually buy or sell depends on the available orders.
A displayed percentage may represent a midpoint or a recent trade. It may differ from the offer available for your order size. Our trading mechanics glossary explains spreads, liquidity and slippage. Polymarket's price explanation is one documented example of how a platform derives its displayed percentage.
Why the odds changed during the tournament
Before kickoff, forecasts had to estimate several stages at once. Once matches were played, results removed possible paths and changed the remaining uncertainty. A team reaching the final faced a different question from the same team before the group stage.
The main drivers are useful to separate:
- Squad and injuries: who was available for the next match, rather than who looked strong months earlier.
- Draw and route: which opponents remained and how many rounds the team still had to survive.
- Performance: chance creation, defensive problems and tactical changes that affected later matches.
- Travel and recovery: the time and conditions between fixtures.
- Trading conditions: liquidity, spreads and the timing of the quoted price.
These are analytical categories, not measured contributions to the historical prices in the table. Without a dated price series, this article cannot attribute a particular move to one injury or result.
The 2026 World Cup tournament guide provides broader competition context. For historical comparison, keep a pre-tournament board separate from group-stage, knockout and final prices. Mixing those stages makes a price change look more surprising than it was.
Odds, the final result and hindsight
A correct favorite does not prove that the quoted probability was well calibrated. An unsuccessful forecast is not automatically irrational either. A low-probability outcome can happen, and a high-probability outcome can fail.
To assess forecasting quality, record predictions before results are known, use consistent scoring and examine many comparable events. Selecting only the winner after the tournament creates hindsight bias. So does rewriting an old estimate as though it always pointed to the eventual champion.
This is why the source table retains its original pre-tournament context even though the result is now known. The relevant question is what the price communicated at the time, not whether the price can be made to look obvious afterward.
Finding a market for another event
For another event, check the current fixture and the status of the specific market on Macro Markets. A completed tournament's winner contract should not be treated as a live opportunity. This article does not verify an open position or offer current 2026 World Cup trading.
For another event, compare the contract's definition, cutoff, source of resolution and available order size before using its displayed percentage. Educational analysis does not remove the risk of losing the full amount committed plus applicable costs.
Frequently asked questions
Are these live 2026 World Cup winner odds?
No. The tournament ended in July 2026. The table contains historical pre-tournament quotes and calculated implied probabilities. It should not be used as a current trading board.
How did Brazil, France and England compare?
In the preview used here, France was +550, England +650 and Brazil +800. Their implied probabilities were approximately 15.38%, 13.33% and 11.11% before margin adjustment. The source, operator and publication context apply to all three.
Did Spain being the favorite guarantee the title?
No. A shorter price describes relative expectations, not certainty. The result is established by the matches; odds describe expectations before those matches were settled.
Can these prices be compared directly with prediction-market percentages?
Only after checking the date, outcome definition, payout structure, fees, margin and liquidity. A bookmaker's quote and an exchange's displayed midpoint can represent different products and execution conditions.
What should I check before using a historical odds table?
Look for the source, publication or quote time, full market definition and whether the numbers are original prices or later calculations. Keep hypothetical examples separate from recorded quotes.
