Brier Score Explained: Formula and Forecasting Examples

The Brier score measures how closely probability forecasts match the outcomes that follow. For binary events, subtract the outcome from each forecast probability, square the difference, then average those squared errors. On the 0–1 scale used in this guide, lower is better.
A Brier score is not the same as a win rate, a calibration test or a profit calculation. A forecast of 70% can be sensible even when the event does not happen. To assess the process, keep a record of forecasts made before the results and compare them over a suitable set of events.
The worked example uses four hypothetical forecasts. These figures do not describe anyone's trading record.
What the Brier Score Measures
A forecast can give a chance rather than a yes-or-no call. A 70% forecast leaves a 30% chance that the event will not happen. Counting each miss as proof of a bad forecast loses that detail.
The Brier score keeps the stated probability in the calculation. It gives a larger penalty to a confident miss than to a less confident miss. The scikit-learn reference documents this squared-error measure and its scoring conventions.
Calibration asks a different question. Among many events given about a 70% chance, did about 70% occur? A single event cannot answer it. A well-calibrated forecast process needs a record of comparable predictions and outcomes, not one successful call.
Calibration alone does not prove useful skill. A process that always says 50% can be calibrated in a set where half the events occur. It still does not distinguish the more likely events from the less likely ones.
The Brier score and a grouped calibration check serve different jobs. Use the score to summarize squared forecast error. Use calibration groups to examine how stated chances line up with observed frequencies.
The Brier Score Formula
For N equally weighted binary forecasts:
BS = (1/N) × Σ(p − y)²
- p is the probability entered before the outcome, from 0 to 1.
- y is the observed outcome: 1 if the defined event happened, 0 if it did not.
- N is the number of scored forecasts.
Convert percentages before calculating. A 70% forecast becomes 0.70, not 70. Keep the event definition fixed. If p is the chance that Yes wins, y must show whether that same Yes outcome occurred.
For one event with p = 0.70 and y = 1, the squared error is (0.70 − 1)² = 0.09. If the event does not happen, y = 0 and the error is 0.49. The higher error reflects the larger gap between the probability and the observed outcome.
Check the Score's Scale
This guide uses the customary binary version, with a range from 0 to 1. Zero means every forecast matched its outcome exactly. A score of 1 is the largest possible error in this version.
Other conventions sum errors across all outcome categories and can use a 0–2 scale. Multiclass scores also need a probability for each category. Check the implementation before comparing published numbers; the scikit-learn documentation explains this distinction. A number on one scale should not be compared directly with a number on another.
Worked Example: Four Forecasts
Suppose these four forecasts were recorded before their events resolved. Each outcome follows a rule fixed in advance.
| Forecast | Probability / outcome |
|---|---|
| 1 | 0.70 / 1 |
| 2 | 0.20 / 0 |
| 3 | 0.60 / 0 |
| 4 | 0.80 / 1 |
Calculate each squared error:
- Forecast 1: (0.70 − 1)² = 0.09.
- Forecast 2: (0.20 − 0)² = 0.04.
- Forecast 3: (0.60 − 0)² = 0.36.
- Forecast 4: (0.80 − 1)² = 0.04.
Add the errors and divide by four:
BS = (0.09 + 0.04 + 0.36 + 0.04) / 4 = 0.1325
That is the mean squared error for these four rows. It is not a 13.25% chance of losing. It is not a 13.25% return or a 13.25% error rate. Squared probability error is a separate measure.
Compare with a Stated Baseline
A reference forecast that always says 50% receives an error of 0.25 for either binary outcome: (0.50 − 1)² = 0.25, and (0.50 − 0)² = 0.25.
| Forecast method | Brier score |
|---|---|
| Four forecasts above | 0.1325 |
| Always 50%, same events | 0.2500 |
The first method has a lower score on this tiny example. Four observations do not establish lasting skill or calibration. The 0.25 reference is a property of always forecasting 50%; it is not a universal threshold for a good score. A base-rate forecast may be a more useful benchmark for another question.
Why Confident Misses Receive Larger Penalties
Hold the outcome fixed at zero. A 60% forecast receives an error of 0.36. A 90% forecast receives 0.81. Greater faith in the event that did not happen creates the larger squared gap.
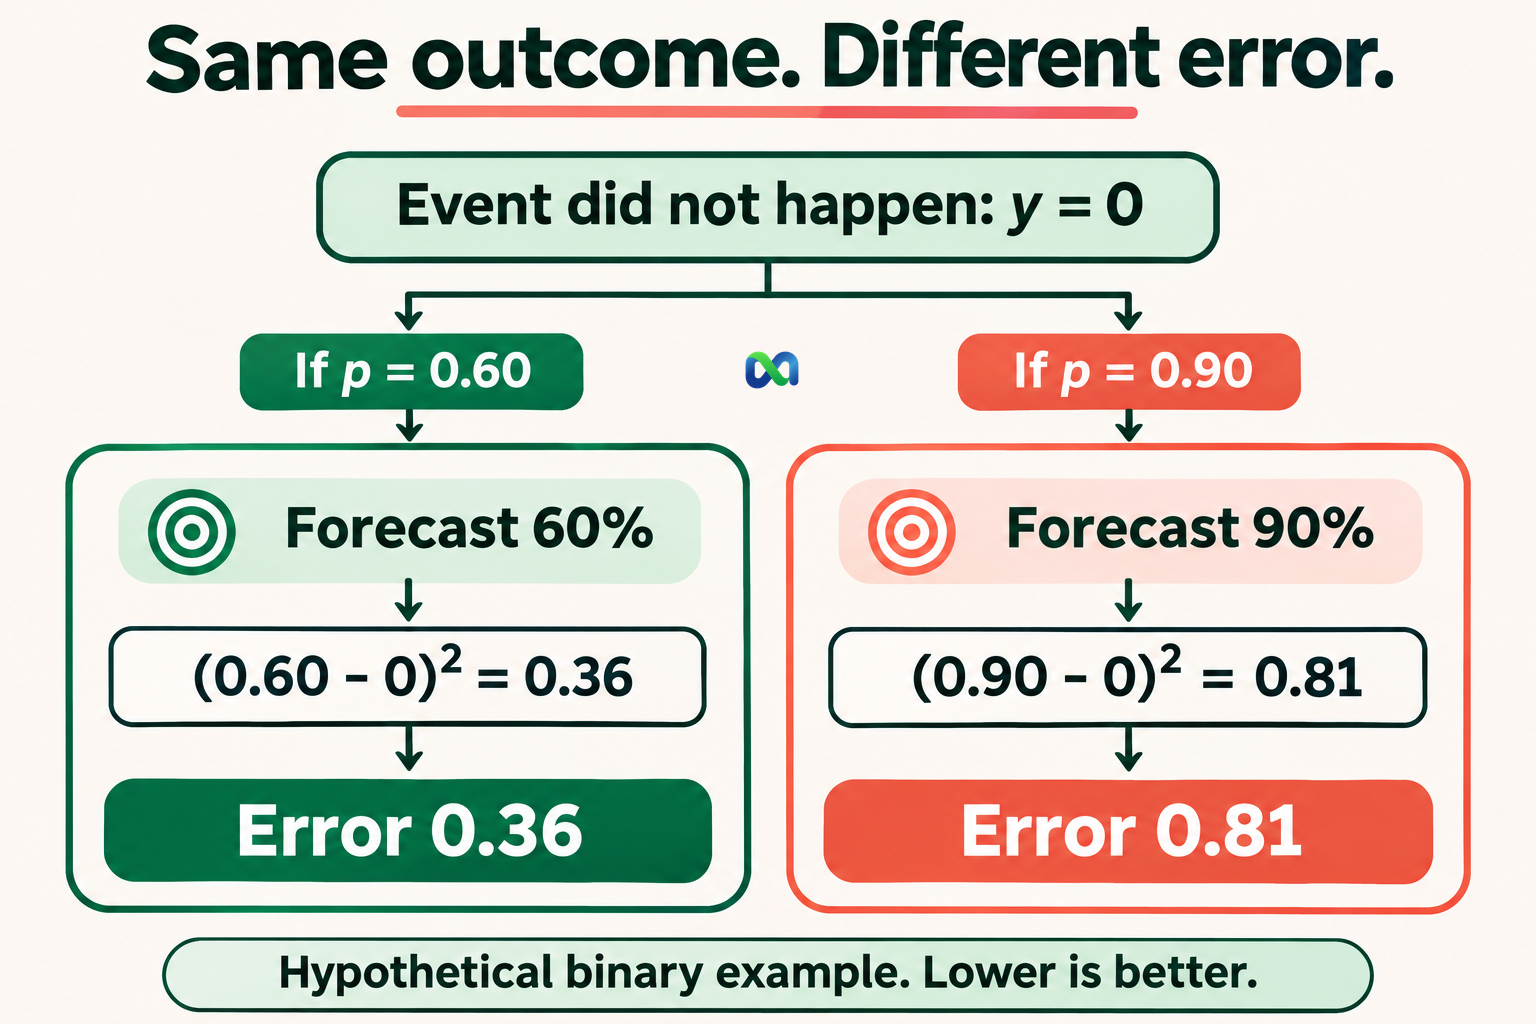
That single result does not reveal the true probability or prove a forecaster's process was unreasonable. Assess it as part of a record, with the original evidence and forecast timing intact. Raising confidence after seeing a result invalidates the comparison.
How to Keep a Forecasting Journal
Record the question precisely enough that its eventual outcome can be checked. A price or a headline is not a substitute for a resolution rule.
| Field | What to record |
|---|---|
| Event | Question and outcome |
| Resolution | Rule and source |
| Time | Before-result UTC time |
| Horizon | Time until resolution |
| Probability | Chance, from 0 to 1 |
| Outcome | Resolved 0 or 1 |
Keep the following rules consistent:
- Freeze each version. Never edit an old probability after the result. If evidence changes beforehand, save a new version with its own timestamp.
- Set the scoring time. If you score several updates, define that policy first. Frequent updates to one question are not automatically independent events.
- Keep the resolution source fixed. Record the observed outcome under the stated rule, rather than treating the market's final price as the outcome.
- Choose inclusion rules in advance. Do not remove forecasts because they turned out badly or add only the ones that support your preferred story.
For calibration, group forecasts into stated probability ranges and compare predicted chances with observed event rates. Keep track of the number of forecasts in each group. A sparse group gives a weak basis for a strong conclusion.
Our forecasting and probability glossary explains base rates, priors and related terms used in this process.
Brier Score Interpretation and Limits
Calibration, Resolution and Uncertainty
The ECMWF Forecast User Guide discusses the classical decomposition into reliability, resolution and uncertainty. Reliability concerns agreement between stated probabilities and observed frequencies in groups. Resolution concerns separating groups whose observed event rates differ from the overall base rate. Uncertainty depends on the outcomes in the dataset.
A low Brier score is therefore not proof of perfect calibration. Different aspects of the forecasts and the event set can affect it. Inspect grouped results as well as the average.
Sharpness is another distinction. It describes how concentrated the forecast distribution is, without using the observed result. For a binary event, a forecast near 0% or 100% is sharper than one near 50%. More extreme forecasts do not automatically earn better Brier scores.
Sample Size, Event Selection and Dependence
You can score any set with at least one valid forecast. How much the score tells you depends on the sample and the test method. There is no fixed count that proves a forecaster is calibrated.
Scoring a hand-picked set can hide weaknesses. So can comparing forecasts with different deadlines or using one person's easy questions against another's difficult ones. Compare forecasts on the same events and at comparable horizons where possible.
Related events also require care. Several contracts about the same election can add rows without adding equally independent evidence. The math still works. A fair test of skill must account for that shared risk.
Forecast Quality Is Not Trading Profit
A score has no entry price, contract size or transaction fee. A well-calibrated forecast can still lead to a losing trade if the paid price is too high or costs outweigh the modeled advantage.
Use the expected value calculator for a supported binary position's entered costs, quantities and probability assumptions. Use the Kelly calculator to examine a separate bankroll-allocation model. Neither calculator verifies your probabilities, and neither turns a low Brier score into a profit guarantee.
Macro Markets publishes these educational tools and operates our own crypto-native prediction-market alternative. This guide evaluates forecasts; it does not claim that a scoring metric validates a particular market, fee schedule or trade.
Frequently Asked Questions
What Is a Good Brier Score?
There is no universal cutoff. Lower is better when the convention and comparison are the same. Check the event set, forecast horizon and a suitable baseline before judging the number.
Was a 70% Forecast Wrong If the Event Failed?
Not necessarily. The forecast leaves a 30% chance that the event will not happen. One outcome produces a scoring contribution, but it cannot establish whether the underlying process is calibrated.
Does Brier Score Measure Profit?
No. It scores probabilities against outcomes. Profit also depends on the executable price, size, costs and the position's rules.
What Is a Proper Scoring Rule?
It rewards reporting the probability you actually believe, in expectation under that belief. The binary Brier score has this property. It does not stop someone from holding a mistaken belief.
How Is Brier Score Different from Accuracy?
A hit rate usually counts correct yes-or-no calls under a chosen threshold. Brier score keeps the probability and measures its squared distance from the outcome. Two forecasts that make the same yes-or-no call can receive different Brier scores.