Implied Probability: Formula, Odds Conversion and Examples
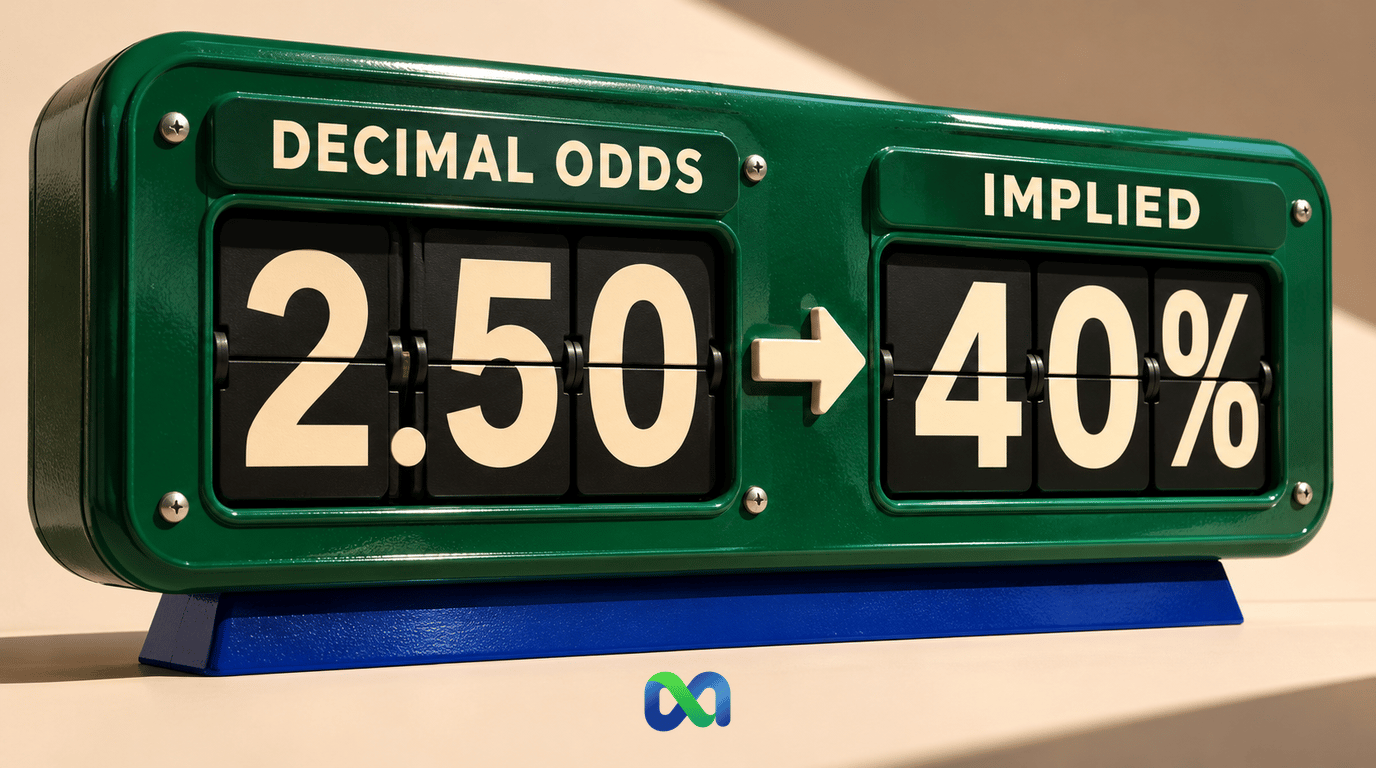
Implied probability is the probability represented by a quoted price or set of odds. To calculate it from decimal odds, divide 1 by the odds and multiply by 100. Decimal odds of 2.50 imply 40%. The conversion describes the price, not the event's true chance.
The same idea applies to a simple prediction contract. If it costs $0.40, pays $1 when Yes wins and pays zero otherwise, its price implies 40% before fees. The payout and settlement rules are essential to that reading.
This guide covers odds conversion, prediction contracts, margin and the gap between a displayed percentage and an executable price. Every numerical example is hypothetical. None represents a live quote, a current fee schedule or a Macro Markets trading result.
What Implied Probability Tells You
A price gives you a threshold to examine. It does not verify the outcome or validate your forecast. Three numbers serve different purposes:
- Price-implied probability: the percentage obtained from the quoted price or odds.
- Your forecast: your own estimate, based on evidence recorded before the outcome.
- Break-even probability after costs: the win rate needed for the modeled position to have zero expected profit.
Without added costs, the first and third can coincide for a simple win-or-lose position. Fees, other charges and settlement terms can separate them. Your forecast can also be wrong, even when it differs from the market.
A price change does not prove that the true probability changed by the same amount. New information, different participants and thin liquidity can all affect a quote. Use the event's rules and the available order size alongside the number on screen.
The Implied Probability Formula for Each Odds Format
Decimal, American and fractional odds can express the same gross return. Conversion should therefore produce the same percentage when the inputs are equivalent. The formulas below follow the gross payout of a standard winning or losing single position, before added costs.
Decimal Odds
Implied probability (%) = 1 ÷ decimal odds × 100
For decimal odds of 2.50:
1 ÷ 2.50 × 100 = 40%
Decimal odds include the original stake in the winning payout. A hypothetical $10 stake at 2.50 returns $25 if it wins. The gross profit is $15, because $10 of that return is the original stake. A standard losing position returns zero.
Dividing by the profit multiplier of 1.50 would answer the wrong question. Use the gross-return multiplier of 2.50.
Positive and Negative American Odds
For positive American odds +A:
Implied probability (%) = 100 ÷ (A + 100) × 100
At +150, the calculation is 100 ÷ 250 × 100 = 40%. The quote means $150 profit on a $100 winning stake, before added costs.
For negative American odds, let A be the positive magnitude of the number:
Implied probability (%) = A ÷ (A + 100) × 100
At −150, use A = 150. The calculation is 150 ÷ 250 × 100 = 60%. That quote requires a $150 stake to earn $100 profit if it wins. Do not insert a negative A into the magnitude-based formula.
Fractional Odds
For fractional odds a/b:
Implied probability (%) = b ÷ (a + b) × 100
At 3/2, the calculation is 2 ÷ (3 + 2) × 100 = 40%. The fraction expresses profit relative to stake. Adding its numerator and denominator accounts for the stake returned in the winning payout.
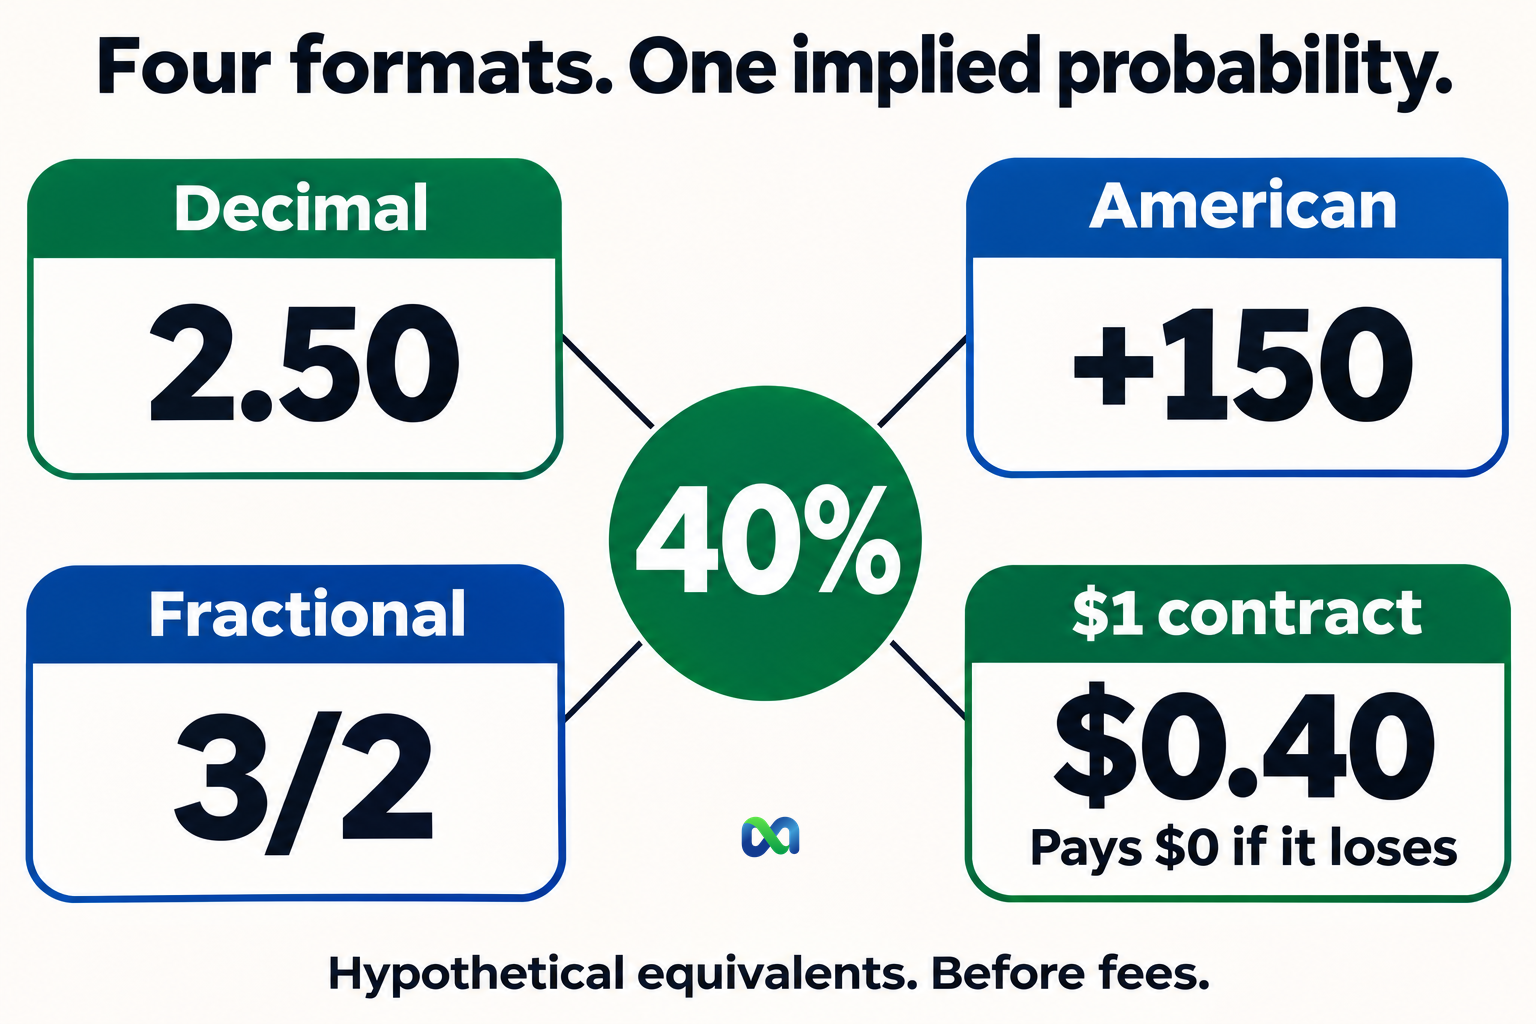
| Quoted odds | Implied probability |
|---|---|
| Decimal 2.50 | 40% |
| American +150 | 40% |
| Fractional 3/2 | 40% |
| American −150 | 60% |
Use our odds calculator to convert between these formats. Its price-derived percentage does not test whether the event is likely to happen.
Implied Probability in Prediction Markets
For a binary contract that pays a known amount if the selected outcome wins and zero otherwise:
Price-implied probability (%) = contract price ÷ winning payout × 100
A $0.40 price with a $1 winning payout implies 40%. A $3 price with a $5 winning payout implies 60%. Reading cents directly as a percentage works only when the winning payout is $1.
The winning payout is the total amount received at settlement, not just the profit. Buying one $1-payout contract for $0.40 produces $0.60 gross profit if it wins, or a $0.40 loss if it loses. These figures exclude fees and assume normal binary settlement.
Check which side the price represents. A Yes quote concerns the event defined as Yes. A No quote concerns the opposite outcome under the same contract rules. A related headline or a different deadline can describe a different event.
A 40% Price Can Require More Than 40% to Break Even
Suppose you buy 100 contracts at $0.40 each. Each pays $1 if the selected outcome wins and zero if it loses. Add a hypothetical $1 total entry charge, paid regardless of the outcome. Assume no other charges, no financing costs and no early sale.
| Item | Amount |
|---|---|
| Contract cost | $40 |
| Entry charge | $1 |
| Total paid | $41 |
| Winning payout | $100 |
| Win profit | $59 |
| Loss if incorrect | $41 |
Let p be your assumed win probability as a decimal. Expected profit is:
p × $59 − (1 − p) × $41 = $100p − $41
Setting that expression to zero gives p = 0.41, or a 41% break-even probability. The raw price still implies 40%. The extra cost raises this position's threshold by 1 percentage point.
The $1 charge is an assumption, not a fee quoted by any platform. A charge on winnings, an exit fee or a different settlement payoff requires different math. Our expected value calculator models supported binary positions from the inputs you enter; it does not supply or verify your probability estimate.
Margin, Overround and Spread
Why Implied Probabilities Can Add Up to More Than 100%
To inspect a full event, use outcomes that are mutually exclusive and together cover every possible result. Convert the odds for each outcome, then add the implied probabilities.
For two hypothetical outcomes at decimal odds of 1.80 and 1.90:
- First outcome: 1 ÷ 1.80 × 100 ≈ 55.5556%.
- Second outcome: 1 ÷ 1.90 × 100 ≈ 52.6316%.
- Total: approximately 108.1871%.
The excess above 100% is 8.1871 percentage points. Here, that excess is what we call the overround. Some sources use “overround” for the full sum instead, so check the definition when comparing figures.
That excess is not automatically the operator's realized profit or every customer's expected loss rate. Research by Tadgh Hegarty and Karl Whelan explains why margin-based loss estimates depend on assumptions about how prices are set across outcomes.
Normalizing Does Not Reveal the True Probability
A common proportional method divides each implied probability by the total:
- First outcome: 55.5556 ÷ 108.1871 ≈ 51.3514%.
- Second outcome: 52.6316 ÷ 108.1871 ≈ 48.6486%.
The normalized values sum to 100%. That is a consequence of the method. It is not evidence that those are the true chances or that the original margin was distributed proportionally. “No-vig probability” should identify the chosen adjustment method, rather than imply that uncertainty has disappeared.
Spread Compares Two Prices for the Same Contract
The best bid is the highest available buy offer. The best ask is the lowest available sell offer. Their difference is the bid-ask spread.
Suppose the same $1-payout contract has a $0.40 bid and a $0.43 ask. Its spread is $0.03. Its midpoint is ($0.40 + $0.43) ÷ 2 = $0.415, which maps to 41.5% on the unit-payout scale.
That midpoint is not necessarily available to trade. Buying at $0.43 and immediately selling at $0.40 loses $0.03 per contract before fees, if both quotes remain available for your quantity. That is about 6.98% of the $0.43 purchase price. It is not a 3% loss on that purchase.
Spread and overround compare different things. Spread concerns buy and sell quotes for one contract. Overround concerns the implied-probability sum across the event's outcomes. An order book can also show Yes and No asks that sum above $1. Both measures require you to state which prices you used.
Reading a Displayed Market Percentage
Last Trade, Midpoint and Executable Price
A market can display its last traded price, a midpoint or another reference. These can differ from the price available for a new order. A small order may also receive a different average fill from a large one.
For example, Polymarket's price documentation says its displayed probability usually uses the bid-ask midpoint. When the spread exceeds $0.10, it uses the last traded price. That is Polymarket's stated method; do not assume Macro Markets or another platform uses it.
Before comparing platforms, match the event definition, deadline, settlement source, timestamp and price type. Two percentages can look different because the contracts or quoted references differ.
Percentage Points and Relative Percentage Change
A move from 40% to 46% is:
- An increase of 6 percentage points: 46 − 40.
- An increase of 15% relative to the starting value: (46 − 40) ÷ 40 × 100.
“Up 6%” is ambiguous. A 6% relative rise from 40% would reach 42.4%, not 46%. Report the starting value, ending value and basis of comparison.
Neither change measures the accuracy of the market. Our Brier Score guide explains how to score recorded probability forecasts against later outcomes. That is a separate task from converting a price into a percentage.
A Checklist Before Using the Number
- Read the contract. Identify the outcome, deadline and resolution rule.
- Confirm the payout. Use the total winning receipt, not the profit alone.
- Identify the displayed price. Distinguish bid, ask, midpoint and last trade.
- Check available size. A visible quote may not cover your full order.
- Account for costs. Include applicable fees and the execution assumptions in the break-even calculation.
- Keep your forecast separate. Explain the evidence behind it and record it before the outcome.
- State the limit. A price-derived percentage is not a verified true probability or a profit guarantee.
Our Kelly calculator addresses a further question: position sizing under entered probability and payoff assumptions. It does not establish that those assumptions are correct.
Macro Markets publishes these educational tools and operates our own crypto-native prediction-market alternative. The hypothetical examples in this guide do not describe our current trading terms. Read the applicable contract rules, costs and access requirements before using any platform.
Frequently Asked Questions
How Do You Calculate Implied Probability from Odds?
For decimal odds, divide 1 by the odds and multiply by 100. For fractional a/b, use b ÷ (a + b). For American odds, use the positive or negative formula above. Multiply decimal probability results by 100 to express them as percentages.
What Probability Does +150 Imply?
Positive American odds of +150 imply 40%: 100 ÷ (150 + 100) × 100. They are equivalent to decimal odds of 2.50 or fractional odds of 3/2, before added costs.
Does a 65-Cent Contract Mean a 65% Chance?
It implies 65% if the contract pays $1 when the chosen outcome wins and zero otherwise, before costs. That conversion does not establish the true chance. Different payouts, fees and settlement rules can change the economic interpretation.
Does Removing the Vig Give the Real Probability?
No. A method such as proportional normalization makes the numbers sum to 100% under its assumptions. It does not independently verify the event probabilities or how the original margin was allocated.
Is Implied Probability the Same as Expected Value?
No. Implied probability converts a price into a percentage. Expected value combines your assumed probability with the position's possible gains, losses and costs. A favorable result from that model still depends on the quality of the inputs.