


P Value: Meaning, Calculation and Statistical Significance

A p value measures how unusual a test statistic at least as extreme as the observed one would be under a specified null hypothesis and statistical model. It is calculated by assuming the null for the purpose of the test. It is not the probability that the null hypothesis is true.
For example, suppose 15 of 20 hypothetical independent binary events occur, and the preselected null says each has a 50% probability. A particular exact two-sided binomial test gives p ≈ 0.0414. That result does not mean there is a 95.86% probability that the underlying probability exceeds 50%.
This guide explains the calculation, the distinction between one-sided and two-sided tests, and the limitations of statistical significance. The event counts are invented teaching inputs, not performance results from Macro Markets or any trading strategy.
What Is a P Value?
A statistical test starts with a null hypothesis, a test statistic, and a rule defining results that are at least as incompatible with the null as the observed result. The p value is the corresponding tail probability under that null model.
The American Statistical Association’s statement emphasizes that p-values do not assign probabilities to hypotheses or measure effect size. Interpreting one requires the model, research design, and reporting choices around it.
A small p value can indicate tension between the data and the null model. That tension could reflect a different population parameter, but it could also reflect invalid assumptions, dependence, data errors, or selective analysis. The calculation does not determine which explanation is correct.
A large p value does not prove the null, either. A small or noisy sample may be compatible with a wide range of effects. Failure to reject one hypothesis should not be reported as evidence that every practically relevant alternative has been ruled out.
How a P Value Is Calculated
The details depend on the test. For a z-test, the statistic is compared with a normal distribution under the null. A t-test uses a t distribution under its assumptions. An exact binomial test works with probabilities for discrete success counts.
The general sequence is to define the null, choose the alternative, select a statistic, specify the sampling distribution under the null, and add the probabilities of sufficiently extreme results. Those choices should be made before inspecting the result whenever the analysis is intended as a confirmatory test.
SciPy’s exact binomial-test documentation specifies the null probability and the available alternatives for a reproducible exact test. The comparison is a decision rule within a model. It does not replace evaluating the size or usefulness of an estimated effect.
Discrete tests need special care because different definitions of a two-sided p value can differ for asymmetric null distributions. State the test and convention instead of treating “two-sided” as a complete computational specification.
Worked Example: 15 Events Out of 20
Assume a fixed sample of 20 independent binary events with the same occurrence probability p. The null hypothesis is p = 0.50. The observed count is 15 occurrences. The alternative for the main calculation is p ≠ 0.50.
Under the null, the count K follows Binomial(20, 0.50). The probability of exactly 15 occurrences is:
P(K = 15) = C(20, 15) × 0.5²⁰ ≈ 0.014786
That probability alone is not the p value. For an upper-tail test, include 15, 16, 17, 18, 19, and 20:
P(K ≥ 15) = 21,700 ÷ 1,048,576 ≈ 0.020695
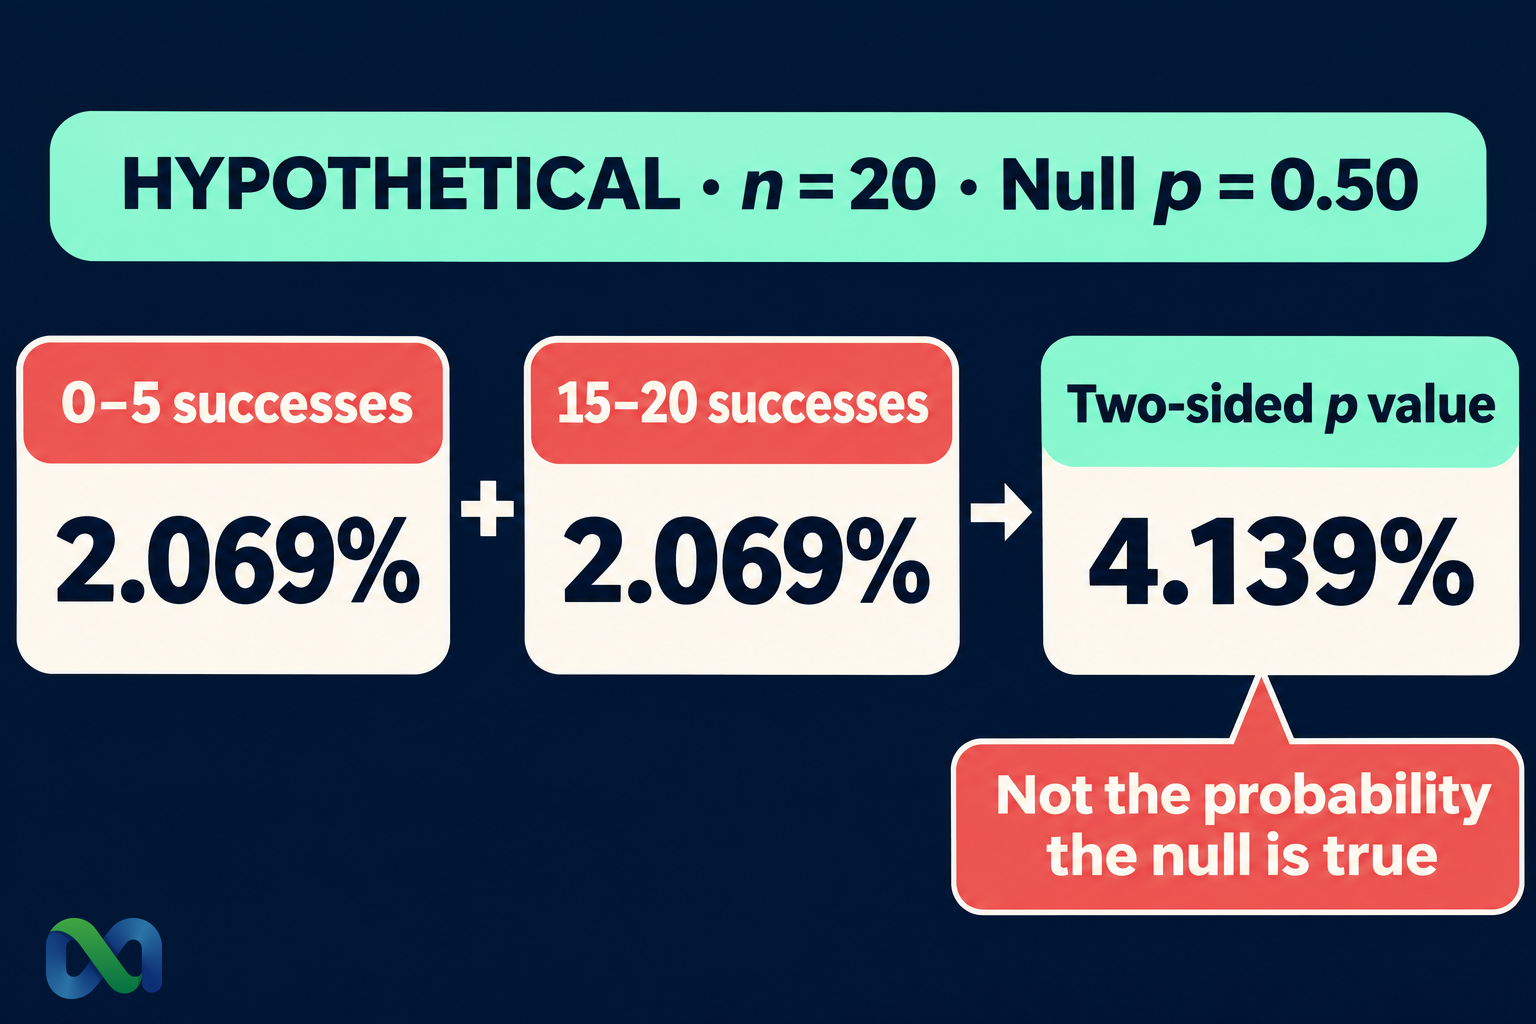
For this symmetric null distribution, the opposite extreme consists of counts zero through five. Its probability is the same. The exact two-sided probability-ordering test therefore gives:
p value = P(K ≤ 5) + P(K ≥ 15) ≈ 0.041389
The unrounded result is about 4.14%. This is the probability of a result in the specified extreme set if the null model and its assumptions hold. The calculation does not assign a probability to the null after observing the sample.
| Event | Counts | Probability |
|---|---|---|
| Observed | 15 | 1.479% |
| Upper tail | 15–20 | 2.069% |
| Two-sided | 0–5; 15–20 | 4.139% |
The binomial distribution guide explains the count formula and why the independence and common-probability conditions matter. An event-occurrence count is also different from a count of profitable trades: purchase prices, fees, and payouts change profitability.
One-Sided vs. Two-Sided Tests
A one-sided alternative specifies a direction, such as p > 0.50. A two-sided alternative considers departures in either direction. In the symmetric example, the two-sided p value is twice the upper-tail probability. That shortcut should not be applied indiscriminately to every discrete or asymmetric test.
The direction should follow the research question. If a meaningful negative effect would change the decision, restricting attention to a positive effect may be inappropriate. Choosing the one-sided alternative after seeing a positive result changes the analysis and makes its nominal error rate misleading.
Suppose the example had produced five occurrences instead of 15. The two-sided test would find the same degree of incompatibility with the 50% null. The preselected upper-tail test would not treat five as evidence for a probability above 50%.
Record the alternative and the stopping rule with the calculation. Testing after every new observation until a threshold is crossed is not the same experiment as collecting a fixed sample of 20 and testing once. Sequential designs can be valid, but they need procedures appropriate to that design.
What Statistical Significance Means
A result is conventionally called statistically significant at level α when its p value meets the chosen rejection rule, often p ≤ α. If α = 0.05 was selected in advance, the worked two-sided result of approximately 0.0414 would reject the 50% null under that rule.
The significance level describes control of false rejections across repetitions of the procedure when the null is true and the assumptions hold. It does not say that this particular rejection has a 5% probability of being wrong. Nor does crossing 0.05 create a sharp scientific difference from a nearby result that falls above it.
Statistical significance also does not measure economic significance. A tiny average effect can become statistically detectable in a large sample while remaining too small to cover transaction costs. A potentially important effect can remain uncertain in a small sample.
Report the estimated effect and uncertainty alongside the p value. Our standard deviation guide explains the dispersion of observations; uncertainty about a mean or proportion requires an appropriate inferential method. Do not reuse a mean interval formula without checking its suitability.
Multiple Testing and Selective Reporting
Testing many hypotheses creates more opportunities to find a small p value. If 20 independent tests each had an actual 5% false-positive probability, the chance of at least one false positive would be:
1 − 0.95²⁰ ≈ 64.15%
This calculation assumes independence and an actual 5% error probability per test. The discrete binomial test above need not have an error rate exactly equal to 5%. The example illustrates multiplicity rather than describing that test’s precise repeated-use behavior.
In a financial analysis, the hidden test family might include many assets, signal thresholds, holding periods, filters, and start dates. Publishing only the best result conceals those choices. A displayed p value cannot correct undisclosed searching by itself.
Depending on the purpose, approaches can include a prespecified primary analysis, multiplicity adjustments, transparent exploratory reporting, or evaluation on fresh data. A holdout dataset loses its value as a fresh check if it is repeatedly consulted while tuning the strategy.
Calculate the Example in a Spreadsheet
For the upper tail in the worked example, use =1-BINOM.DIST(14,20,0.5,TRUE) in an English-language spreadsheet. Subtracting the cumulative probability through 14 includes the counts starting at 15.
For this specific symmetric two-sided test, use =2*(1-BINOM.DIST(14,20,0.5,TRUE)). The result is approximately 0.041389. This is a shortcut for the stated example, not a universal formula for two-sided exact binomial tests.
Retain unrounded values during the calculation. Display p = 0.0414 rather than p = 0.04 if that precision helps another reader reproduce the result. A displayed zero from software often reflects rounding or numerical limits; it is not a literal zero probability for every possible model.
Before interpreting the output, verify the event definitions, sample count, independence assumptions, and stopping rule. A correct formula can still answer the wrong question if the input is a selected subset of observations or if a different null probability was intended.
Applying P Values to Financial Research
A p value can assess compatibility with a particular benchmark. It cannot determine whether an available price is attractive. A position with a high outcome-occurrence probability can have negative expected value at an expensive entry price, especially after costs.
Use the expected value formula to connect a forecast with price and payoff. Keep that economic calculation separate from a test of a historical average or frequency. Both calculations also depend on the quality of the forecast and data.
Market dependence complicates inference. Positions linked to the same announcement or macroeconomic factor may not be independent. Testing them as separate identical trials can understate uncertainty. A historical strategy can also change as liquidity, rules, and participant behavior change.
For a useful research record, save the hypothesis, test statistic, alternative, sampling rule, costs, effect estimate, uncertainty measure, and all tested variants. That record makes a result interpretable and gives a later out-of-sample check a clear target.
Frequently Asked Questions
Is a p value the probability that a result happened by chance?
That phrasing leaves out the model and is misleading. A p value is a tail probability under a specified null model. It does not partition a result into “chance” and “real effect” explanations.
Does a p value below 0.05 prove a strategy works?
No. The result can depend on assumptions, multiplicity, selection, and the chosen benchmark. Economic usefulness additionally depends on effect size, price, costs, capacity, and performance on data that were not used to choose the strategy.
Should I report only significant results?
Report the analysis relevant to the research question, including uncertain results and the range of analyses conducted. Selecting only threshold-crossing results prevents readers from assessing the full evidence.
