


Risk Reward Ratio: Formula, Examples and Break-Even Win Rate
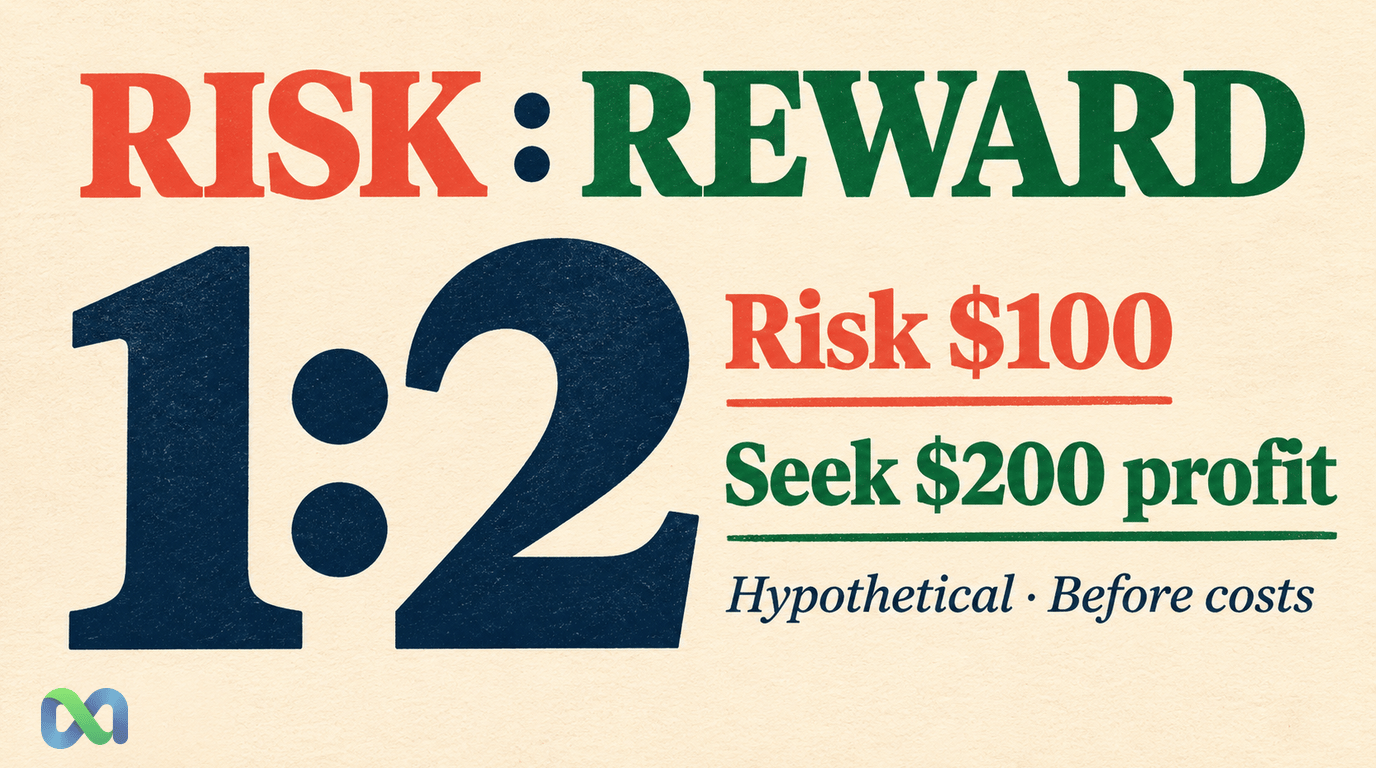
A risk reward ratio compares how much you could lose with how much you could earn on a trade. Risking $100 to seek $200 of profit gives a 1:2 risk-to-reward ratio. It says nothing, by itself, about how likely that profit is.
That distinction matters. A trade with a large profit target can still have negative expected value. Fees can also turn a setup that looks profitable into one that loses money on average.
This guide defines the ratio, works through 1:2 and 1:3 examples, and shows how to calculate the break-even win rate. Every price and trade below is hypothetical. The examples explain the math; they are not live quotes or trading recommendations.
What Is a Risk Reward Ratio?
The risk reward ratio puts a potential loss beside a potential profit. In this guide, risk comes first. A ratio of 1:3 means risking one dollar to seek three dollars of profit.
Use profit after recovering your stake, rather than the total amount paid back. If a position costs $100 and pays back $300 in total, the profit is $200. Losing the full $100 would make that a 1:2 risk-to-reward setup.
Risk-to-reward and reward-to-risk are inverses
Writers and trading tools do not always use the same convention. Someone may call a setup “2:1” while meaning two dollars of reward for each dollar at risk. Others put the loss first and call that same setup “1:2.”
Always check which amount comes first. “Risk $100 to seek $200 profit” removes the ambiguity better than an unexplained ratio.
The ratio also needs a defined outcome. A planned exit price gives you a planned loss, not a guaranteed maximum loss. A contract held to settlement may have a different loss amount from a plan to sell it early.
How to Calculate the Risk Reward Ratio
Start with two amounts measured on the same basis:
- L: the positive dollar amount lost in the losing outcome.
- W: the positive dollar profit earned in the winning outcome.
The risk-to-reward comparison is L: W. To express the risk as one unit, divide both sides by L:
Risk-to-reward ratio = 1:(W ÷ L)
If a calculator asks for a single number instead, check its definition. Risk divided by reward is L ÷ W; reward divided by risk is W ÷ L. For a 1:2 setup, those numbers are 0.5 and 2, respectively.
Worked example: entry, stop, and target
Suppose you buy 10 shares at $50 each. You plan to exit at $48 if the trade moves against you, or at $54 if it moves in your favor. Ignore costs for this first calculation.
The planned loss is 10 × ($50 − $48) = $20. The target profit is 10 × ($54 − $50) = $40. The planned ratio is therefore $20:$40 = 1:2.
Notice that the $500 purchase cost is not the planned loss in this example. The plan assumes an exit at $48. If the position instead became worthless, the purchase cost would matter to a different loss calculation.
The CME Group lesson on risk management connects loss limits, position size, and profit exits. Treat those inputs as a trading plan whose execution still needs to be assessed.
An actual fill may differ from a planned exit. The SEC’s explanation of stop orders notes that a stop price triggers an order; it does not guarantee the execution price. A stop-limit order can constrain the fill price, but may not execute.
What Win Rate Do You Need to Break Even?
A payoff ratio becomes more useful when paired with a probability estimate. For a model with only two possible net outcomes, a profit of W or a loss of L, expected value is:
EV = p × W − (1 − p) × L
Here, p is the chance of the winning outcome. Set EV to zero and solve for p:
Break-even win rate = L ÷ (W + L)
This is an average-profit threshold in the stated model. It does not promise that any particular series of trades will break even.
The table assumes two possible outcomes and no costs.
| Risk: reward | Break-even rate |
|---|---|
| 1:1 | 50% |
| 1:2 | 33.3% |
| 1:3 | 25% |
| 1:4 | 20% |
The 1:2 threshold is exactly one-third; 33.3% is rounded. For a 1:3 setup, one $300 win offsets three $100 losses before costs. Those outcomes total zero, rather than a profit.
You need a win probability above the applicable threshold for positive expected value. Reaching a target less often than that threshold produces negative expected value, even if each win is much larger than each loss.
Fees move the threshold
Suppose a trade has a $200 gross profit if it wins and a $100 gross loss if it loses. Now assume a fixed $10 total cost per trade, charged in either outcome.
The net winning profit falls to $190, while the net losing amount rises to $110. The break-even win rate becomes:
$110 ÷ ($190 + $110) = 36.7%, rounded.
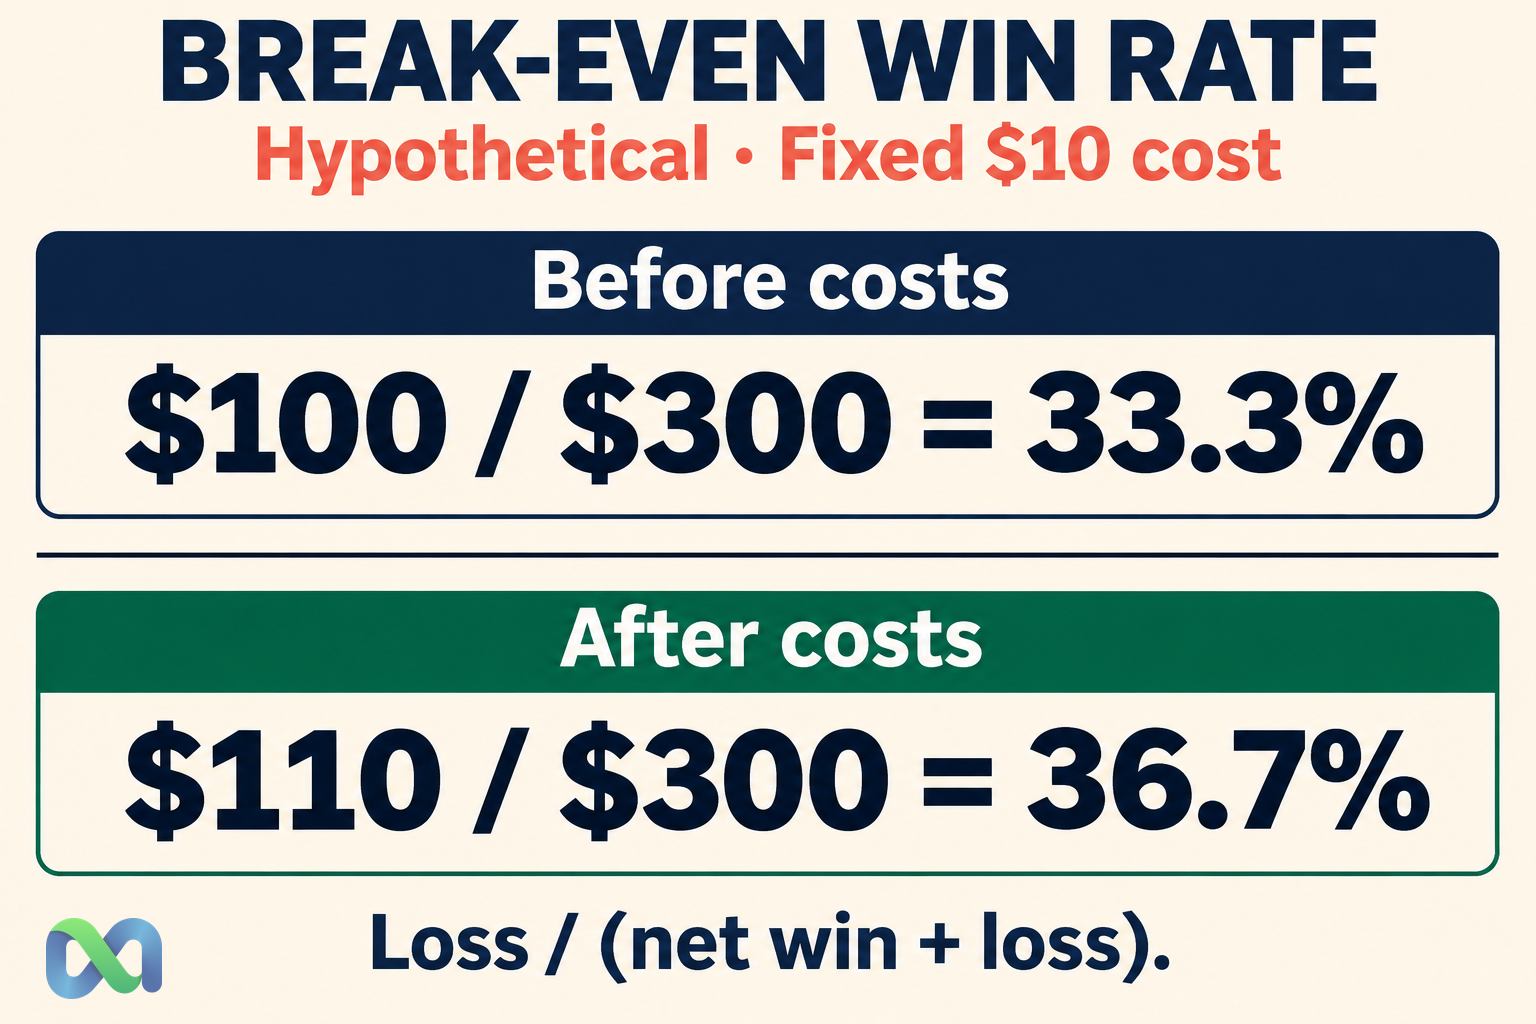
At a 35% win probability, the setup has expected value of +$5 before costs: 0.35 × $200 − 0.65 × $100. After the $10 cost, expected value falls to −$5: 0.35 × $190 − 0.65 × $110.
Real costs may depend on the outcome, quantity, price, or route. Use net winning profit and net losing amount for that specific setup. If the two outcomes have different charges, account for each separately. Do not subtract the same fee again after already including it in W and L.
Why a High Reward-to-Risk Ratio Can Still Lose Money
A larger target does not establish a higher chance of reaching it. Changing the target can also change the chance of a win, so you cannot safely change one input while treating the other as fixed.
Consider a hypothetical setup with a $300 winning profit and a $100 loss. Its risk-to-reward ratio is 1:3.
At a 20% win probability, expected value is 0.20 × $300 − 0.80 × $100 = −$20. At a 30% win probability, it is 0.30 × $300 − 0.70 × $100 = +$20.
The payoff amounts are identical. The probability estimate changes the conclusion. Our expected value guide explains how to combine the possible outcomes with their chances.
Check actual outcomes against the plan
Planned targets are inputs, not a performance record. If winners close early or losing trades fill beyond the intended exit, the realized payoff ratio may differ from the planned one.
For a trading record, compare average net winning profit with average net losing amount. Then assess the observed win rate, sample size, and whether the conditions behind those results still apply. A short run of wins does not prove a stable edge.
The two-outcome formula also needs care when trades can end with partial exits, several profit levels, or a flat result. In that case, calculate expected value across all modeled outcomes. Do not force every result into a single target-or-stop assumption.
Risk Reward Ratios in Prediction Markets
A binary contract gives a clear teaching example because we can state both settlement outcomes. Assume you buy one contract for $0.40, hold it to settlement, and receive $1 if the specified outcome occurs or $0 otherwise.
Before fees, the losing amount is $0.40 and the winning profit is $0.60. That gives $0.40:$0.60 = 1:1.5, with a break-even win probability of 40%.
Now assume a hypothetical $0.02 total charge per contract, paid in either settlement outcome. This is an illustrative cost assumption, not a fee quote for Macro Markets or another platform.
| Hypothetical contract input | Amount |
|---|---|
| Purchase price | $0.40 |
| Total charge in either outcome | $0.02 |
| Net loss if it settles at $0 | $0.42 |
| Net profit if it settles at $1 | $0.58 |
The net risk-to-reward ratio is $0.42:$0.58, or about 1:1.38. The break-even probability is:
$0.42 ÷ ($0.58 + $0.42) = 42%
If your estimated chance of the outcome is 45%, expected value per contract is 0.45 × $0.58 − 0.55 × $0.42 = $0.03. The result depends on that probability estimate and every assumption above.
For this specific $1-or-$0 settlement model, with a price c and a fixed charge f paid in either outcome, net profit is 1 − c − f and net loss is c + f. The break-even probability is c + f. This simplification assumes those are the only costs and that a winning outcome still earns a positive net profit.
Different settlement rules, outcome-dependent fees, or an early sale require a different calculation. Read the actual rules and cost schedule before using a quoted price as an input. Our prediction markets glossary explains the core contract terms.
Macro Markets readers can apply the same habit: state the contract’s payout, purchase price, costs, and forecast probability before comparing payoffs. This settlement example does not assume that a particular early-exit order is available or that a displayed price can be filled.
Use the Ratio Without Oversizing the Position
The payoff ratio and the amount you risk answer different questions. Doubling the size of a position doubles both potential outcomes in a simple model with no size-related price or cost changes. It leaves the ratio unchanged while increasing the dollars at risk.
For example, risking $100 to seek $200 and risking $1,000 to seek $2,000 are both 1:2 setups. They do not have the same effect on an account after a loss.
Before using a ratio, check four inputs:
- Outcome: Is the loss based on settlement or a planned exit?
- Costs: Are winning profit and losing amount both net of the relevant charges?
- Probability: What evidence supports the chance of reaching the winning outcome?
- Size: What would the loss mean for the account, including other related positions?
Use the expected value calculator to compare a probability estimate with the stated payoffs. Check how its inputs define stake, payout, and costs before transferring your numbers.
Position sizing is a separate decision. The Kelly criterion guide explains a probability-based sizing model and why uncertain estimates matter. A favorable-looking ratio is not, on its own, a reason to take a larger position.
Frequently Asked Questions
Is a 1:2 risk reward ratio good?
It describes risking one unit to seek two units of profit. Whether the setup has positive expected value depends on the win probability and net payoffs. Before costs, a two-outcome 1:2 model breaks even at a win probability of one-third.
Is 1:3 always better than 1:2?
It offers more potential profit for each unit at risk, but the larger target may be less likely to occur. Compare each setup’s probability, costs, and possible execution outcomes. The ratio alone cannot rank their expected profitability.
Can a strategy be profitable with a win rate below 50%?
Yes, in a model where net wins are large enough relative to net losses. A $300 win and a $100 loss break even at a 25% win probability before costs. A probability above that threshold gives positive expected value under those assumptions.
Is risk reward ratio the same as expected value?
No. The ratio compares the sizes of a potential loss and profit. Expected value also uses the chances of the modeled outcomes. Two trades with the same payoff ratio can have opposite expected values.
Does a stop-loss guarantee the loss amount used in the ratio?
No. A stop price can trigger an order whose fill differs from that price. A stop-limit order may not fill. Use the actual order rules and execution assumptions when assessing the amount at risk.
