


Sharpe Ratio: Formula, Examples and How to Interpret It

The Sharpe ratio compares the average return above a cash benchmark with how much those extra returns vary. The usual benchmark is a risk-free cash return for the same period.
A higher positive ratio means more extra return for each unit of volatility in that sample. It is not a win probability or a percentage return.
This guide explains the Sharpe ratio formula, calculates a small example, and shows why timing, costs, and the choice of inputs matter. All numerical examples are hypothetical. They illustrate the calculation, not a live portfolio, interest-rate quote, or expected result.
What Is the Sharpe Ratio?
The Sharpe ratio puts excess return and volatility into one number. It compares what a portfolio earned above cash with the spread of those extra returns over time.
It therefore differs from simply dividing return by volatility. If the reference return is positive, omitting it can change the ratio and the comparison between portfolios.
William F. Sharpe’s original explanation of the ratio distinguishes a historical calculation from a forward-looking estimate. Here, we calculate the ratio from past returns. A future estimate needs its own return and risk assumptions. Those inputs are uncertain.
A ratio, not a probability or percentage
A Sharpe ratio of 0.50 does not mean a 50% chance of profit or a return of 0.50%. Both parts use the same return units, so those units cancel.
The return frequency still matters. A monthly Sharpe ratio of 0.50 and an annualized Sharpe ratio of 0.50 are different measurements. Label the frequency and any annualization method rather than reporting an unexplained number.
The Sharpe Ratio Formula
Start with returns measured over matching periods. For each period, calculate:
Excess return = portfolio return − reference cash return
Then calculate the arithmetic average of those excess returns and their sample standard deviation, abbreviated SD:
Historical Sharpe ratio = mean excess return ÷ sample SD of excess returns
This guide uses the sample SD convention, with n − 1 in the variance denominator, where n is the number of observations:
Sample SD = √[sum of squared deviations from the mean ÷ (n − 1)]
Find each excess return’s gap from the mean. Square each gap, add the squares, divide by n − 1, and take the square root. You need at least two observations and a nonzero SD for a finite ratio under this convention.
Why some formulas use portfolio volatility
Some formulas divide the average excess return by the SD of portfolio returns. That gives the same result when the cash return is fixed across periods. Subtracting a constant does not change the SD.
If the cash return varies, subtract it in each period first. Then find the SD of those excess returns. It need not match the SD of portfolio returns alone.
Keep the units consistent. Monthly returns need cash returns for those same months. Subtracting an annual cash rate from an average monthly return mixes periods and can mislead.
How to Calculate the Sharpe Ratio: A Worked Example
Suppose a hypothetical portfolio has the following three monthly returns, already net of the costs assumed in this example. Assume a reference cash return of 0.25% in each month. This fixed rate is a teaching input, not a current market quote.
| Month | Return | Excess |
|---|---|---|
| 1 | −0.75% | −1.00% |
| 2 | 1.25% | 1.00% |
| 3 | 3.25% | 3.00% |
The excess returns are −1%, 1%, and 3%. Their arithmetic mean is:
(−1% + 1% + 3%) ÷ 3 = 1% per month
In percentage-point units, the deviations from that mean are −2, 0, and 2. Their squared values are 4, 0, and 4. Using the sample convention:
Sample variance = (4 + 0 + 4) ÷ (3 − 1) = 4
Taking the square root gives an SD of 2 percentage points of monthly return. The Sharpe ratio is therefore:
Monthly Sharpe ratio = 1% ÷ 2% = 0.50
You get the same result using decimals: 0.01 ÷ 0.02 = 0.50. Mixing 1 with 0.02, however, would be a unit error.
Keep arithmetic averages separate from compounded returns
Use the arithmetic mean of the period excess returns. A compounded return answers a different question: how the value grew or fell across the full span as returns built on each other.
Do not substitute a three-month compounded return into a formula whose denominator is a monthly SD. Likewise, do not change from sample SD to population SD without declaring it. The population convention divides the squared deviations by n and would give a different answer for this small sample.
Three months make the math easy to check. They do not prove a long-term track record or a stable future Sharpe ratio.
How to Interpret a Sharpe Ratio
When mean excess return is positive, a larger ratio means more of that return for each unit of SD. Match the dates, return frequency, cash benchmark, and costs before comparing two ratios.
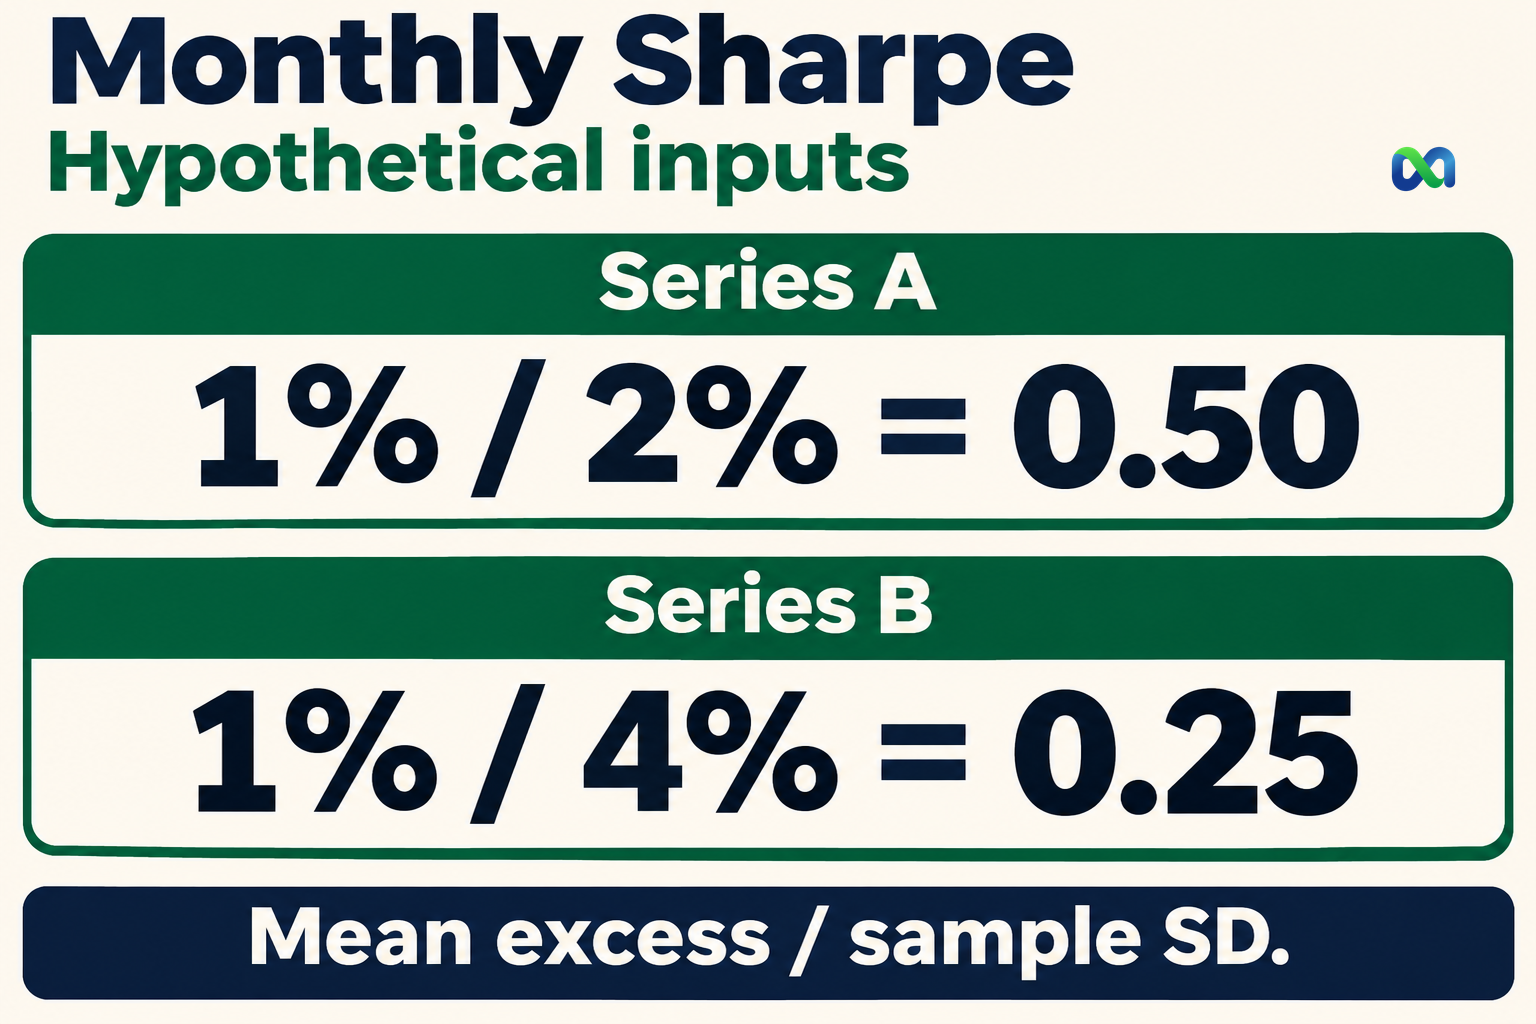
Consider two hypothetical monthly excess-return series. Series A is the worked example, −1%, 1%, and 3%. Series B is −3%, 1%, and 5%. Both have a mean excess return of 1% per month, but B has wider swings around that mean.
| Series | Sample SD | Sharpe |
|---|---|---|
| A | 2% | 0.50 |
| B | 4% | 0.25 |
The arithmetic is 1% ÷ 2% = 0.50 for A and 1% ÷ 4% = 0.25 for B. A has the higher positive ratio in this comparison. That observation does not establish which portfolio will perform better next month.
What is a good Sharpe ratio?
There is no single cutoff that makes every portfolio good. Look at the return history, how often values were sampled, the sample size, costs, price sources, and risks that SD misses.
A very high ratio from a short or unusually smooth sample deserves scrutiny. It may reflect an unrepresentative period, stale prices, or a calculation choice. It is not proof of skill or a guarantee that future losses will be small.
The CFA Institute discussion of Sharpe ratio limitations emphasizes that one volatility statistic does not describe every kind of investment risk. Use the ratio alongside other information about the portfolio.
Negative and undefined ratios need care
A negative Sharpe ratio means the average excess return was below zero in the measured sample. The average return was below the cash benchmark. The portfolio’s own return need not have been negative.
Ranking negative ratios mechanically can mislead. With a mean excess return of −1%, an SD of 2% gives −0.50. Raising the SD to 4% produces −0.25, a number closer to zero. More volatility has raised the ratio without fixing the negative average excess return.
If SD is zero, division by zero prevents a finite ratio. Do not automatically report zero or interpret the result as proof of unlimited performance. A flat sample can also reflect missing or stale observations rather than an absence of risk.
Annualizing the Sharpe Ratio
A common convention multiplies a monthly Sharpe ratio by the square root of 12:
Annualized Sharpe ≈ monthly Sharpe × √12
As a purely numerical illustration, 0.50 × √12 ≈ 1.73. This is not a forecast of a 1.73% return, nor does it turn the three-month teaching sample into an annual performance record.
The shortcut uses a model with strict assumptions. Returns have regular time steps, a stable mean and variance, and no correlation across time. Compounding makes the scaling more complex.
Andrew W. Lo’s research on the statistics of Sharpe ratios examines estimation uncertainty and why simple annualization can fail when returns are correlated over time. A square-root multiplier is not a universal conversion for every strategy.
State the sampling frequency, window, and method. Irregular per-trade results are not automatically a daily return series. Changing the number of periods per year changes the multiplier. It does not fix gaps, dependence, or poor input data.
Limits for Prediction Market Portfolios
Calculating a portfolio Sharpe ratio requires a defined return series. A single contract price, one realized profit, or a forecast probability is not such a series.
For a prediction market portfolio, record how account values become returns. Separate deposits and withdrawals from investment performance, use consistent time intervals, and state the currency or unit. Choose a matching reference rather than mixing a dollar benchmark with returns measured in another unit.
Marked returns, execution, and costs
Displayed portfolio values can differ from the proceeds available on an actual exit. Thin liquidity, spreads, position size, and fees may affect those proceeds. A return series based on infrequent marks can also look smoother than the underlying economic exposure.
State whether the values are marked, realized, or based on estimated executable exits. Include the relevant costs consistently. If returns already reflect a charge, subtracting it again understates performance.
Event settlement can create abrupt changes in value. You can still compute the ratio when sample SD is nonzero. But it does not show all risks, such as skewed outcomes or rare large losses. It also depends on how well the marks reflect value.
Compare it with drawdown and other risk measures
Maximum drawdown measures the deepest decline along a value path. Standard deviation measures variation around a mean. Our maximum drawdown guide explains why the size and timing of a loss need their own analysis.
Sortino ratio uses downside variation relative to a selected target rather than treating all variation alike. State the target and calculation convention before comparing it with Sharpe; the two ratios answer different questions.
A trade’s risk reward ratio compares potential payoff sizes. The Kelly criterion addresses position sizing under a probability-and-payoff model. Neither is a substitute for measuring a historical return series.
Macro Markets readers can use these distinctions to keep contract rules, forecasts, account performance, and position size separate. The derivatives, risk, and analytics glossary provides the related terminology. No single ratio decides whether a position should be opened, increased, or closed.
Frequently Asked Questions
Is a higher Sharpe ratio always better?
Among comparable samples with positive mean excess returns, it indicates more excess return per unit of measured volatility. Check the data, costs, window, and risks outside that statistic. Negative ratios require extra care, and historical rankings need not persist.
Can a positive-return portfolio have a negative Sharpe ratio?
Yes. If its average return is positive but below the matching reference cash return, its average excess return is negative. With a positive SD, that produces a negative Sharpe ratio.
Should I use sample or population standard deviation?
Declare the convention. This guide uses sample SD, dividing the squared deviations by n − 1. Population SD divides by n. They can produce meaningfully different results in a small dataset.
Does Sharpe ratio measure the chance of losing money?
No. It combines an average excess return with a measure of variability. It does not directly state the probability or size of a future loss, and it can miss features of the return distribution that matter to that risk.
How much data do I need?
Two observations with a nonzero sample SD are enough to perform the arithmetic, but that does not make the estimate reliable. The useful history depends on the strategy, return process, data quality, and intended comparison. Report the sample size rather than hiding it behind one number.
