


Maximum Drawdown: Formula, Examples and Recovery Math
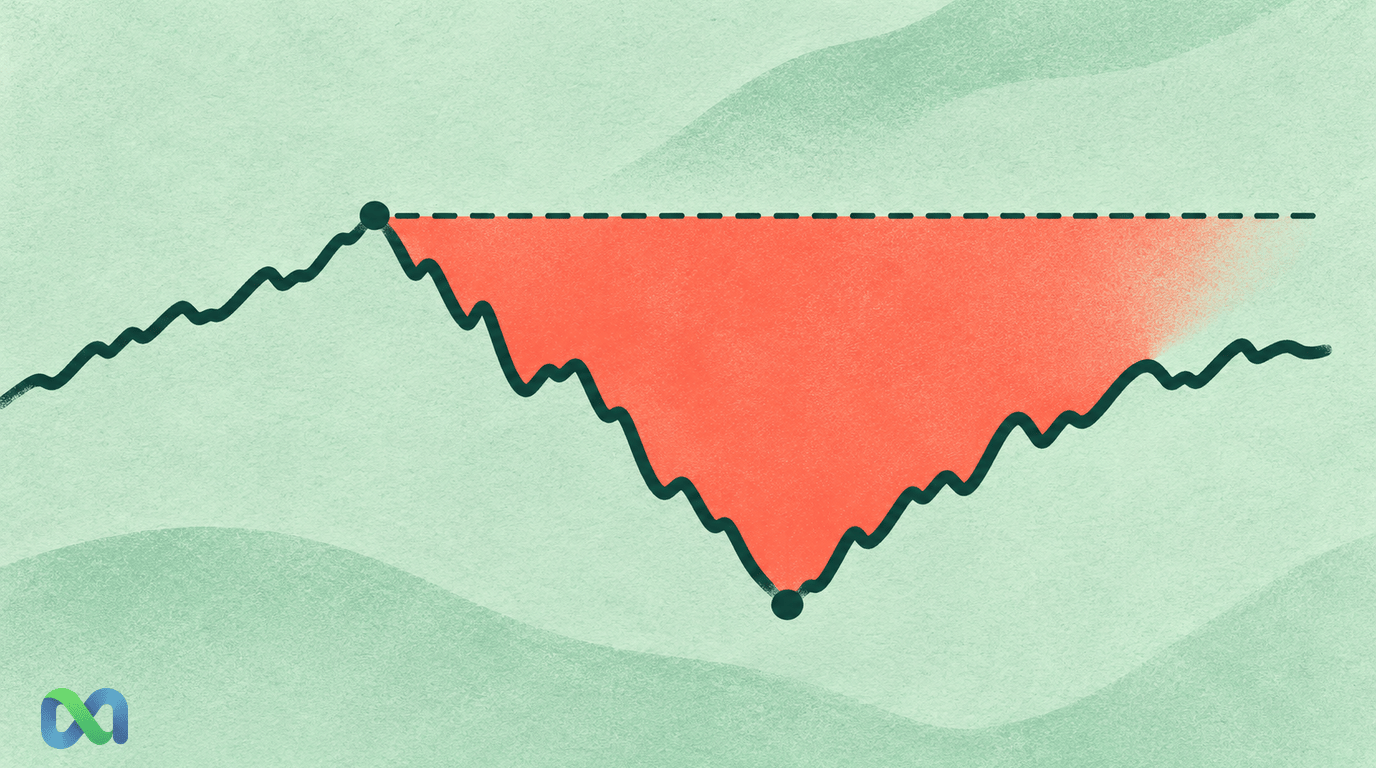
Maximum drawdown is the largest percentage fall from an earlier equity peak to a later low within a stated measurement period. It describes the worst decline in that record, rather than the decline from the latest peak to today.
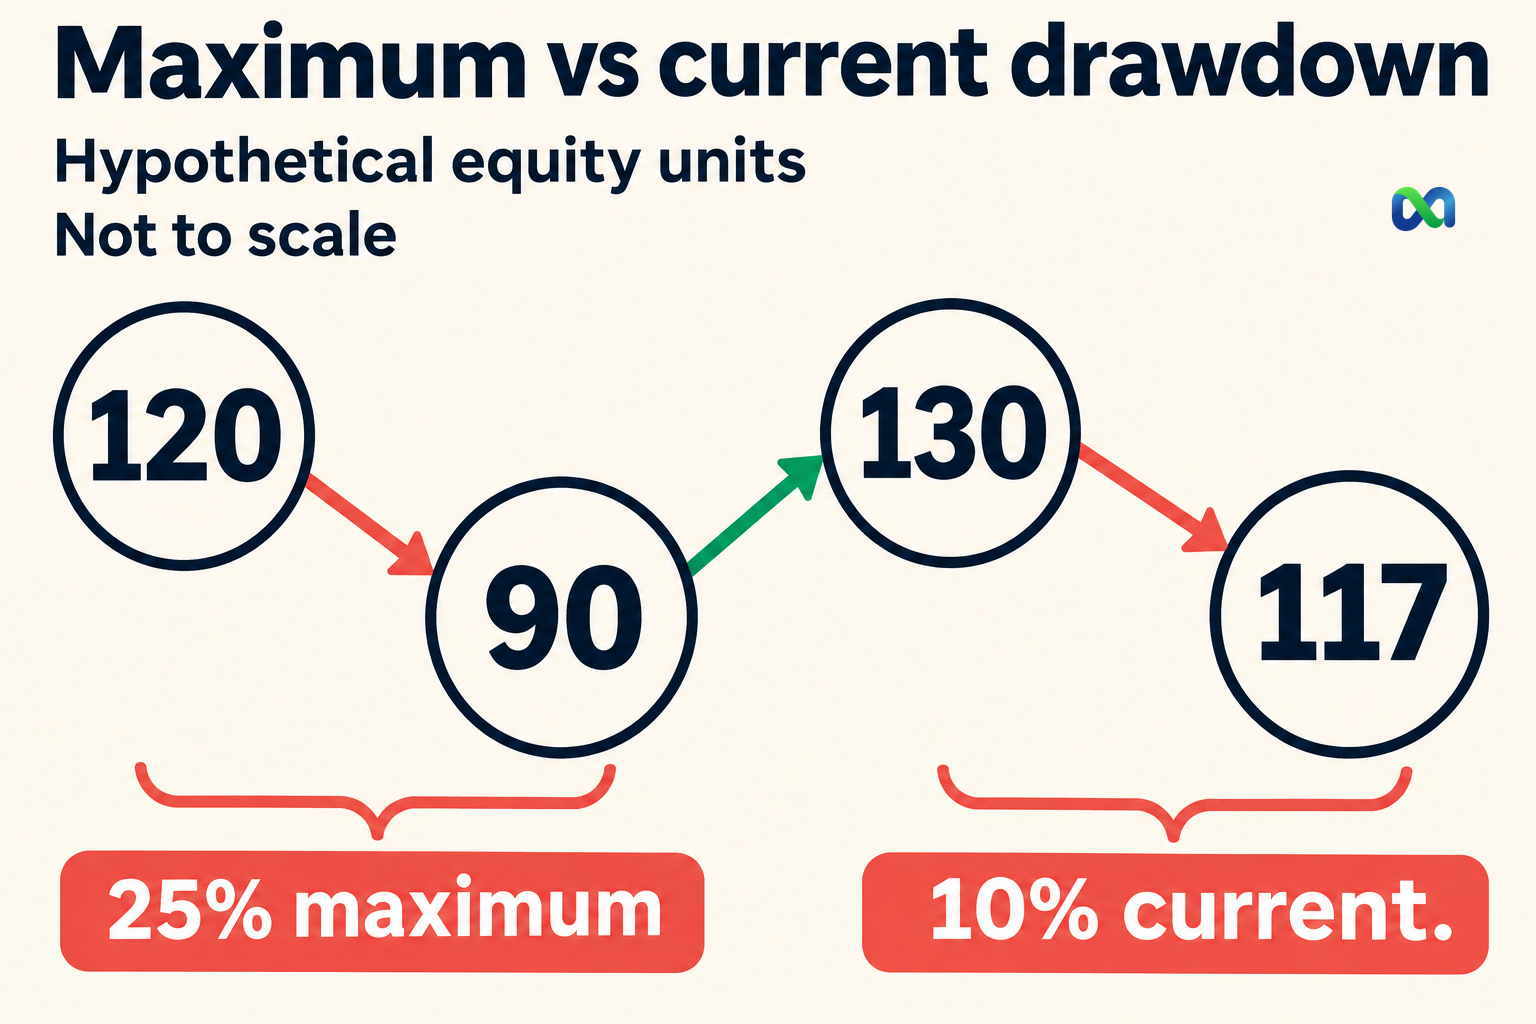
A portfolio can be 10% below its current peak even though it previously suffered a 25% maximum drawdown. Recovering that earlier 25% loss would require a 33.3% gain from the low, because the gain starts from a smaller base.
This guide explains the maximum drawdown formula, walks through a chronological example, and separates recovery math from a forecast of recovery. All portfolio values below are hypothetical units, not live prices or performance claims.
What Is Maximum Drawdown?
Maximum drawdown, often shortened to MDD or max drawdown, measures the deepest percentage decline from a prior high in a value series. The peak must come before the low. A later high cannot be paired with an earlier low to create a larger loss.
Drawdown is measured against equity: the value of the account or portfolio under the valuation method you choose. For an account with no external cash flows, a fall from 100 units to 80 units is a 20% drawdown from that peak.
The PerformanceAnalytics documentation describes the calculation using cumulative returns and the highest cumulative value reached so far. The key idea is to track the running peak as the series develops.
Current drawdown and maximum drawdown answer different questions
Current drawdown asks how far the latest value is below the highest value reached so far. Maximum drawdown asks which such decline was largest across the full measurement window.
Making a new high resets current drawdown to zero. It does not erase an earlier maximum drawdown from the same historical window. That older loss remains part of the record until you change the measurement window or the underlying series.
You also do not need to wait for a recovery before measuring a decline. An ongoing fall can be the largest drawdown observed so far.
The Maximum Drawdown Formula
Let V be the portfolio value at a particular observation and H the highest value reached up to and including that observation. For a positive peak H, the drawdown is:
Drawdown = (H − V) ÷ H
This gives a decimal. Multiply by 100 to express it as a percentage. The maximum drawdown is the largest drawdown found as you repeat the calculation across the chosen series.
For one peak-to-trough episode, you can write the same calculation as:
Peak-to-trough drawdown = (peak − later trough) ÷ peak
The chronological order matters as much as the arithmetic. Calculate each point against the high available at that time, rather than dividing the full period’s highest-to-lowest difference by its highest value.
Check the sign convention
This guide reports drawdowns as positive loss magnitudes. A 25% drawdown means the value fell by 25% from its prior peak. Some systems display that same decline as −25%, using V ÷ H − 1.
Both conventions can describe the same path. State which one you use before comparing reports. Under the negative convention, the deepest observation is the most negative value; it is not the largest signed number.
If you start with periodic returns, first build a consistent wealth index by compounding them. Include the starting value so that a loss in the first period is measured against a baseline. Adding percentage returns together does not generally produce the same index.
Worked Example: Maximum Versus Current Drawdown
Consider six observations of a hypothetical portfolio. Values are in the same units throughout. There are no deposits, withdrawals, fees, or other costs in this example.
| Point | Equity | Drawdown |
|---|---|---|
| 1 | 100 | 0% |
| 2 | 120 | 0% |
| 3 | 90 | 25% |
| 4 | 110 | 8.33% |
| 5 | 130 | 0% |
| 6 | 117 | 10% |
At point 2, equity reaches a peak of 120. It then falls to 90 at point 3. The decline is (120 − 90) ÷ 120 = 25%.
At point 4, the previous high is still 120. Equity has risen to 110, so current drawdown at that point is (120 − 110) ÷ 120 = 8.33%, rounded.
Point 5 establishes a new high of 130. At the final observation, equity is 117. The latest decline is (130 − 117) ÷ 130 = 10%.
The portfolio’s maximum drawdown is 25%, while its current drawdown is 10%. The earlier drop from 120 to 90 was deeper, in percentage terms, than the later drop from 130 to 117.
Why the period’s highest and lowest values can mislead
The highest value anywhere in this example is 130, and the lowest is 90. Pairing them would give about 30.77%. That is not a valid drawdown episode here: the value of 90 occurred before the value of 130.
The portfolio also finishes 17% above its starting value of 100. A positive start-to-finish return can coexist with a large loss along the way. Maximum drawdown records part of that path; total return does not show it on its own.
Drawdown Recovery: Why the Percentages Differ
A percentage loss uses the earlier peak as its base. The gain needed to regain that peak uses the smaller remaining value as its base.
For a positive remaining value, the recovery calculation is:
Gain needed to recover = peak ÷ remaining value − 1
If the loss is written as a decimal d, the same result is d ÷ (1 − d), provided d is less than 1.
| Loss from peak | Gain to recover |
|---|---|
| 10% | 11.1% |
| 20% | 25% |
| 25% | 33.3% |
| 50% | 100% |
The 11.1% and 33.3% entries are rounded. In the worked example, recovering from the trough of 90 to its preceding peak of 120 requires 120 ÷ 90 − 1 = 33.3%, rounded. The gain is 30 units on a base of 90.
At the final value of 117, the relevant peak is now 130. Regaining that peak requires 130 ÷ 117 − 1 = 11.1%, rounded. Do not carry the old peak of 120 into this later recovery calculation.
Recovery gain is not recovery time
These formulas tell you the percentage gain required to reach a stated level. They do not tell you whether that gain will occur or how long it will take.
Two portfolios can suffer the same maximum drawdown but spend very different amounts of time below their peaks. To discuss recovery, report the observation dates and whether the previous peak has actually been regained. An unrecovered decline has no completed recovery time yet.
A 100% loss leaves zero value in this simple model. No finite percentage gain on zero restores the old peak. The recovery formula above therefore requires a positive remaining value.
What Changes the Drawdown Number?
The calculation is only comparable when the underlying series and measurement choices are comparable. State the window, observation frequency, valuation method, unit, and treatment of cash flows and costs.
Measurement window and observation frequency
An account’s largest decline over five years can differ from its largest decline over the past month. State whether you use only peaks inside the chosen window or carry an earlier account high into it.
Daily closing observations can also miss declines that occurred and reversed within a day. A series sampled only after trades close can miss losses that occurred while positions were open. The formula cannot reveal observations absent from its input data.
Deposits, withdrawals, and costs
Suppose an account falls from 100 to 80 units, then receives a 20-unit deposit. Its balance returns to 100, but the extra cash does not represent an investment gain. A withdrawal can likewise lower the balance without being a trading loss.
Keep account-balance drawdown separate from drawdown in a return index adjusted for external cash flows. The GIPS handbook’s calculation methodology illustrates why performance reports need explicit periods and defined return inputs. Its pension-provider reporting framework has its own requirements; this guide does not claim to reproduce that framework.
Specify whether the series is before or after fees. Avoid subtracting charges a second time if they are already reflected in the values. Keep the currency or unit consistent as well: a portfolio measured in dollars can follow a different path from the same holdings measured in a cryptoasset.
Marked value and an executable exit
For a prediction market portfolio, separate the displayed valuation from the amount you could receive by selling. Available buy orders, position size, spread, fees, and slippage can affect the proceeds of an early exit.
Polymarket’s price and order-book documentation provides an external example of how quoted prices and available orders relate. It is a reference to that platform’s mechanics, not a statement about Macro Markets order types.
A portfolio marked at 117 units may not be fully sellable for 117 units. State whether your drawdown series uses marked values, estimated exit proceeds, or realized cash results. The arithmetic stays simple, but those inputs can change its meaning.
What Maximum Drawdown Does Not Tell You
A historical maximum drawdown is not a ceiling on future losses. A short or favorable sample can omit the conditions that would produce a deeper decline. The number also does not give the probability of a prediction market outcome.
Maximum drawdown differs from a trade’s planned payoff ratio. Our risk reward ratio guide compares a possible loss with a possible profit. Drawdown instead measures declines along a value path. A stop or profit target does not, by itself, establish an account’s future drawdown.
It also does not determine position size. The Kelly criterion guide explains how a sizing model depends on probability and payoff estimates. Neither an attractive ratio nor a small historical drawdown proves that those estimates are accurate.
Several positions can share the same driver and fall together. The independent events guide explains why separate labels do not establish independence. In a portfolio, shared exposure can matter more than the number of contracts held.
Macro Markets readers can use drawdown to describe a portfolio’s path while keeping the market’s outcome rules and valuation assumptions separate. Our prediction markets glossary explains the core contract terms. A past decline, on its own, is not a reason to hold, sell, or add to a position.
Frequently Asked Questions
How do you calculate maximum drawdown?
Track the highest equity value reached so far at each observation. Subtract the current value from that peak and divide by the peak. The largest resulting loss percentage over the measurement window is maximum drawdown under the positive-loss convention used here.
Is maximum drawdown the same as the largest losing trade?
No. A portfolio decline can span several trades or changes in the value of open positions. A trade-level loss and an account-level drawdown use different observations and can have different denominators.
Can maximum drawdown decrease after a recovery?
For an unchanged historical series and a fixed starting point, extending the record cannot erase the earlier maximum. Current drawdown can fall to zero while that historical maximum remains. A rolling window may report a smaller maximum when the old decline moves outside the window.
What is a good maximum drawdown?
There is no single percentage that answers this for every portfolio. Compare the measurement period, sampling, valuation method, costs, returns, and exposures. A low number from a short record is not proof of low future risk.
Does a 25% loss need a 25% gain to recover?
No. Starting at 100, a 25% loss leaves 75. A 25% gain on 75 reaches only 93.75. Returning to 100 requires a gain of one-third, or about 33.3%, before any additional costs.
