


Sortino Ratio: Formula, Examples and Sharpe Comparison
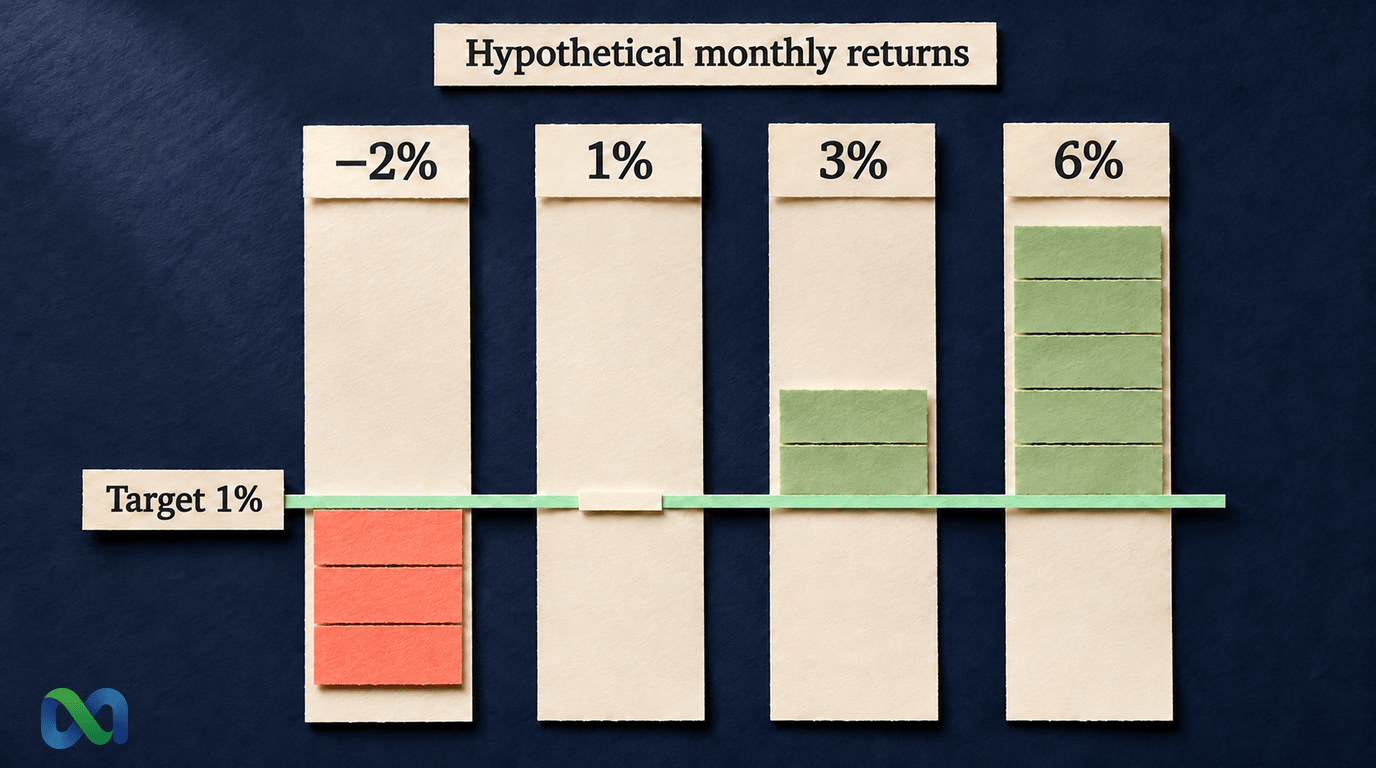
The Sortino ratio compares average return above a chosen target with the size of shortfalls below that target. It focuses on missing the goal rather than on every upward and downward move.
That distinction matters when a portfolio has large gains as well as losses. A high Sortino ratio still does not prove that a strategy is safe or that its next trade will earn a profit.
This guide explains the Sortino ratio formula, works through four hypothetical monthly returns, and compares it with Sharpe. Every numerical example is a teaching input, not a live interest rate, portfolio record, or forecast.
What Is the Sortino Ratio?
The Sortino ratio shows average return above a target per unit of measured downside deviation. Downside deviation summarizes how far returns fell below that target over the measured periods.
The target is often called the minimum acceptable return, or MAR. It can be zero, a cash reference, or another stated goal. It does not have to equal the risk-free rate.
A positive return can still miss the goal. If the monthly target is 1%, a return of 0.5% falls short by 0.5 percentage points. A return of 3% has no shortfall against that target, although it still affects the average return.
What the number does and does not say
A Sortino ratio of 0.67 is a ratio, not a 0.67% return or a 67% chance of success. The return units in its numerator and denominator cancel.
You also need the target, time period, and calculation method. Two reports can show different ratios for the same portfolio. Check which inputs each one used. A ratio without those details is difficult to assess.
Our risk and analytics glossary places the term alongside related measures. This guide shows the arithmetic behind it.
The Sortino Ratio Formula
For a fixed target over equally spaced periods:
Sortino ratio = (arithmetic mean return − target return) ÷ downside deviation
This article uses an empirical, full-period method. We calculate from observed returns and count every period in the denominator. For each period:
Shortfall = max(target return − period return, 0)
The max operation keeps the larger of the two inputs. A missed target produces a positive shortfall. Meeting or exceeding the target produces zero.
Then calculate:
Downside deviation = √[(sum of squared shortfalls) ÷ n]
Here, n is the total number of valid return observations, including periods with zero shortfall. Square the shortfalls, add them, divide by n, and take the square root.
The PerformanceAnalytics implementation of downside deviation documents this full-period approach. It also exposes a different subset option. State the method when comparing outputs; switching the denominator changes the result.
Match the target to the return period
Monthly returns require a monthly target in the same units. Do not subtract an annual goal directly from an average monthly return.
If an annual compounded goal must be converted into a constant monthly equivalent, the conversion is (1 + annual goal)^(1/12) − 1, using decimal returns. This is a conversion of the chosen target. It does not annualize the observed Sortino ratio or establish that the goal is achievable.
The example below starts with a monthly target, so no conversion is needed. If the target changes each period, match each return with its own target first. Do not replace those targets with one convenient rate.
How to Calculate the Sortino Ratio
Assume these four monthly portfolio returns, already net of the costs included in this hypothetical example. Set a fixed target of 1% per month. This is an illustrative goal, not a recommended return or a current cash rate.
| Month | Return | Shortfall |
|---|---|---|
| 1 | −2% | 3% |
| 2 | 1% | 0% |
| 3 | 3% | 0% |
| 4 | 6% | 0% |
The last column measures the gap below the 1% target. It does not show the portfolio's loss in each month. In month one, losing 2% leaves a three-percentage-point gap to the goal.
Step 1: Find the average return above the target
The arithmetic mean return is:
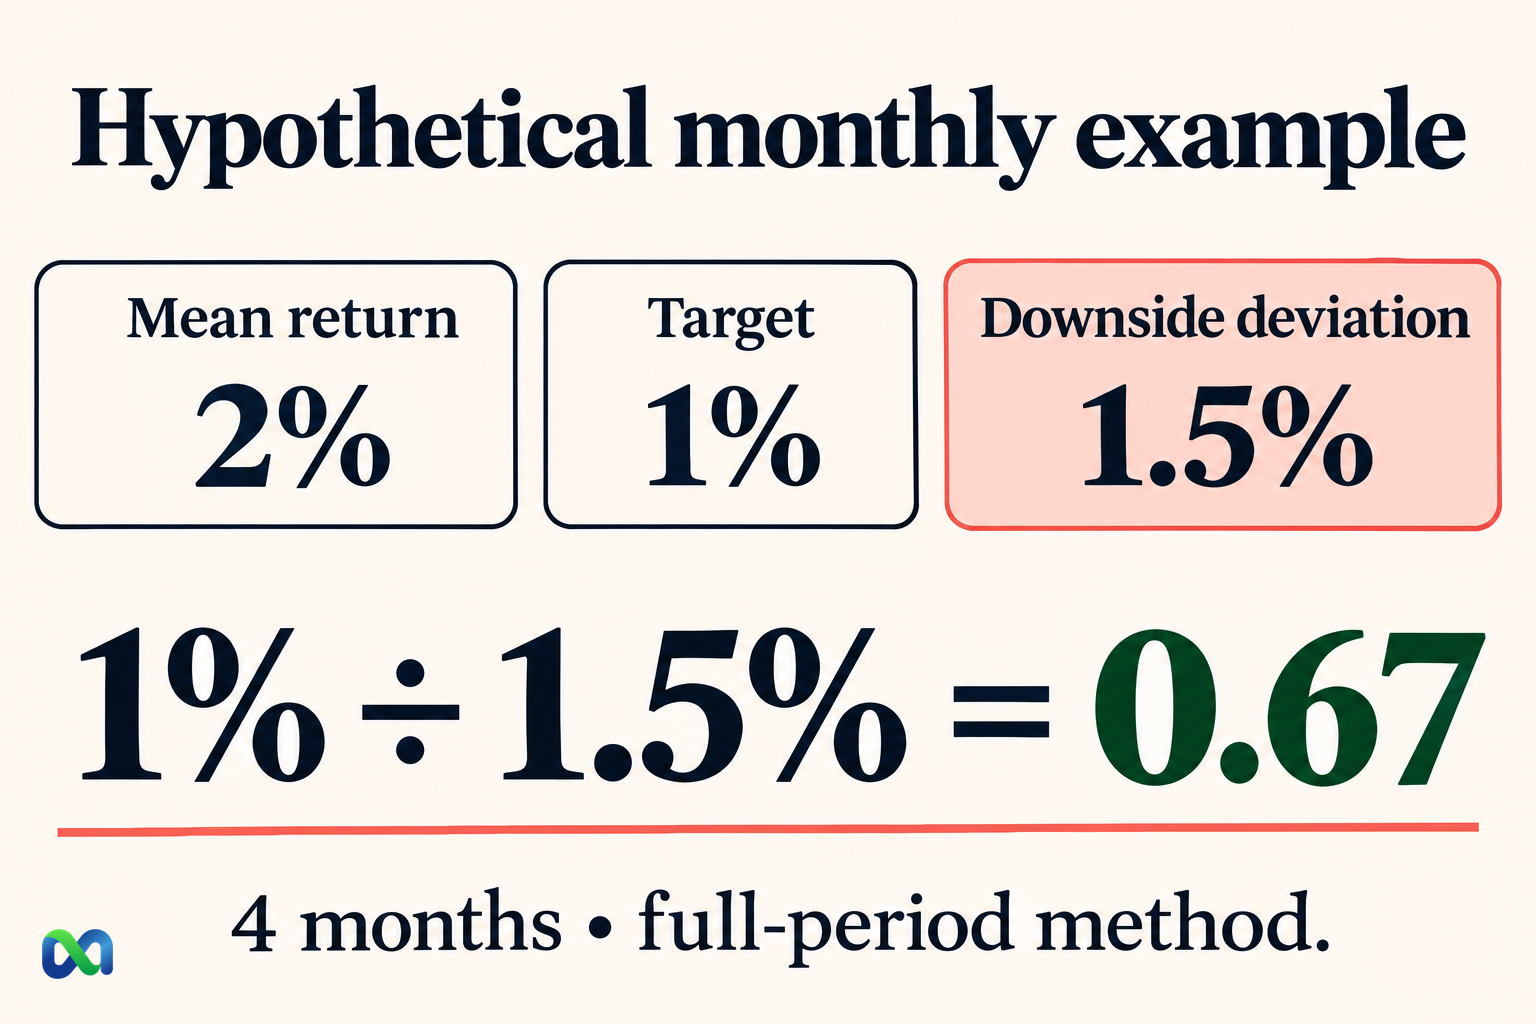
(−2% + 1% + 3% + 6%) ÷ 4 = 2% per month
Subtract the monthly target:
2% − 1% = 1% per month above target
Use the mean of all four returns. Averaging only the positive months would answer a different question. A compounded return across the four months would also be a different input.
Step 2: Calculate downside deviation
In percentage-point units, the shortfalls are 3, 0, 0, and 0. Their squared values are 9, 0, 0, and 0:
Downside deviation = √[(9 + 0 + 0 + 0) ÷ 4] = √2.25 = 1.5 percentage points
All four months remain in the denominator, even though only one misses the target. This is not the sample standard deviation formula, so we do not substitute n − 1.
Step 3: Divide and label the result
Monthly Sortino ratio = 1% ÷ 1.5% = 0.6667, or approximately 0.67
Decimal inputs give the same result: 0.01 ÷ 0.015. Report the ratio as 0.67, without a percent sign. Label it monthly and disclose the 1% monthly MAR and full-period downside method.
If we divided the squared shortfalls by only the one below-target month, downside deviation would be 3%. The resulting ratio would be about 0.33. That is a different calculation, not the full-period result shown here.
How to Interpret the Sortino Ratio
A positive ratio means the average return exceeded the chosen target, provided downside deviation is positive. A negative ratio means the average return fell below it. A portfolio can have a positive average return but still miss a higher target. Its Sortino ratio would then be negative.
Compare samples with the same inputs and positive numerators. A larger ratio means more average return above target per unit of measured downside deviation. It does not state the probability or size of the next loss.
What is a good Sortino ratio?
There is no universal cutoff that makes every portfolio good. First check the target, dates, costs, and amount of data. Match how often returns were sampled and how positions were valued.
Four months make this example easy to audit. They do not establish a reliable long-term estimate. A high ratio from a short, unusually favorable period can omit events that matter greatly to future losses.
The CFA Institute analysis of the Sortino ratio discusses these limits, including the effect of calculation choices and sparse downside observations. An observed sample is not a complete picture of possible outcomes.
Changing the target changes the result
Keep the same returns, but lower the hypothetical monthly target to 0%. The arithmetic mean is still 2%. Only the −2% month has a shortfall, now two percentage points:
Downside deviation = √[(4 + 0 + 0 + 0) ÷ 4] = 1%
Monthly Sortino ratio at a 0% target = 2% ÷ 1% = 2.00
The portfolio did not improve. We changed the question. Comparing 2.00 at a zero target with 0.67 at a 1% target without disclosing the difference would mislead.
Zero downside and negative ratios
If every observed return meets the target, this calculation gives zero downside deviation. Division by zero does not produce a finite Sortino ratio. Do not turn that into proof of unlimited performance or an absence of risk.
A short record may simply contain no relevant adverse event. Missing data or stale marks can also hide shortfalls. Negative ratios need care too: a larger denominator can move a negative ratio closer to zero without repairing below-target average performance.
Sharpe Ratio vs Sortino Ratio
The main distinction is the reference and the risk measure used in each calculation.
| Measure | Reference | Risk input |
|---|---|---|
| Sortino | Target | Shortfalls |
| Sharpe | Cash | Excess SD |
The historical Sharpe calculation uses the mean return above a benchmark and the standard deviation, or SD, of those excess returns. William Sharpe's original explanation sets out that relationship. Our Sharpe ratio guide includes a separate worked example.
For Sortino, only below-target shortfalls enter the downside calculation, but all observed returns affect the arithmetic mean. Sharpe's SD responds to moves on both sides of the excess-return mean.
A cash benchmark and a chosen target can differ. Even if they happen to match, the denominators still measure different things. A Sortino ratio of 2 and a Sharpe ratio of 1 do not establish that one portfolio is twice as good.
Why drawdown still matters
Neither ratio directly shows the deepest fall from a previous portfolio peak. Our maximum drawdown guide explains that separate question.
With a fixed target, reordering the same returns leaves this Sortino calculation unchanged. It can change the path of portfolio value and its drawdowns. Use the measures together when the sequence of losses matters.
Limits for Prediction Market Portfolios
A forecast probability, a single contract price, or one realized profit is not a regularly sampled portfolio return series. Calculating Sortino starts with a clear account-value history and a stated target.
Separate deposits and withdrawals from investment performance. Keep the currency, return intervals, target, and costs consistent. A target expressed in dollars cannot simply be paired with returns measured in a different unit.
Marked values can hide shortfalls
Account marks may differ from the proceeds available on an actual exit. Thin liquidity, spreads, fees, and position size can affect that exit. Infrequent marks may make a return series look smoother than the exposure it represents.
State how positions were valued and which costs are included. A sudden settlement loss may be absent from a short window that ends before the event resolves. A high historical ratio does not remove that exposure.
For Macro Markets readers, the practical lesson is to keep market rules, forecasts, account returns, and risk measures separate. The risk reward ratio of a trade addresses potential payoff sizes, rather than the history of an account.
Do not apply annualization automatically
Multiplying a monthly Sortino ratio by √12 is not a universal conversion. Combining periods changes how returns build on each other. It also changes how shortfalls relate to the target. Return dependence and sparse losses add further problems.
Report the actual monthly measure and its inputs unless you have a justified annual method. State any assumptions. Neither a multiplier nor a four-month example creates an annual track record.
Frequently Asked Questions
Is the Sortino ratio a percentage?
No. Its numerator and denominator use the same return units, so they cancel. Report 0.67 as a ratio, alongside the frequency, target, and downside calculation method.
Does a positive month count toward downside deviation?
It can. A positive return below the target still creates a shortfall. Under the full-period method, months at or above target contribute zero squared shortfall but remain in the total observation count.
Should I divide by all months or only the bad months?
This guide divides squared shortfalls by all valid months. Dividing by only the below-target months produces a different result. Do not change the convention silently when comparing portfolios or software reports.
Is Sortino always better than Sharpe?
No. They summarize different features of return data and may use different reference returns. Neither describes every risk, replaces a drawdown analysis, or predicts whether the next position will profit.
Can I calculate Sortino from one successful trade?
A trade profit is not enough to establish a useful portfolio return history. Define the capital base, observation periods, cash flows, costs, and target first. A history with no measured shortfall also has a zero denominator under this method.
