


Variance: Formula, Examples and Portfolio Risk

Variance measures spread by averaging squared distances from a mean. A larger variance indicates more dispersion around that mean under the dataset or probability model being used.
In finance, variance is a building block of portfolio risk calculations. It gives weight to both unusually positive and unusually negative returns, and it must be interpreted in squared units.
This guide explains population and sample variance, calculates both from the same returns, and shows how covariance enters a portfolio calculation. The returns and portfolio assumptions are hypothetical examples rather than reported investment performance.
What Is Variance?
Imagine two return series with the same average. One stays close to that average, while the other swings widely above and below it. Variance distinguishes their spread even though the average return is identical.
Subtracting the mean produces deviations. Simply averaging those deviations would give zero because positive and negative differences cancel. Squaring them makes each contribution nonnegative and gives larger deviations more weight.
The NIST guide to measures of scale explains the sample calculation and why extreme observations can strongly influence it. Standard deviation is the square root of variance and returns the result to the original measurement units.
This guide covers statistical variance
“Variance” also appears in accounting as the difference between a budget and an actual result. That is a different use of the word.
Here, variance means dispersion around an average. A return 3 percentage points above its mean and a return 3 percentage points below it each contribute 9 percentage-points squared to the sum of squared deviations.
The calculation can describe an observed dataset or a probability distribution. State which one you mean. A small historical variance is a description of the observations, not proof that future returns will stay close to their average.
Population and Sample Variance Formulas
For a complete finite population of N equally weighted values:
Population variance, σ² = sum[(x − μ)²] ÷ N
Here, μ is that population's mean. For a sample of n observations used to estimate a wider population's variance:
Sample variance, s² = sum[(x − x̄)²] ÷ (n − 1)
The sample mean x̄ is estimated from those same observations. Under independent sampling from a population with finite variance, dividing by n − 1 makes this sample variance an unbiased estimator of population variance.
That property does not make a tiny sample precise or representative. It addresses one estimation issue under specified assumptions; it does not fix selected data, dependence, or a changing return process.
Variance for probability-weighted scenarios
When scenarios have known or assumed probabilities, use:
Var(X) = sum[p × (x − μ)²], where μ = sum(p × x)
The probabilities must sum to one. This is not a sample-variance calculation, so do not automatically substitute n − 1 into it. Equal-probability scenarios and historical observations can look similar in a table while serving different purposes.
How to Calculate Variance: A Worked Example
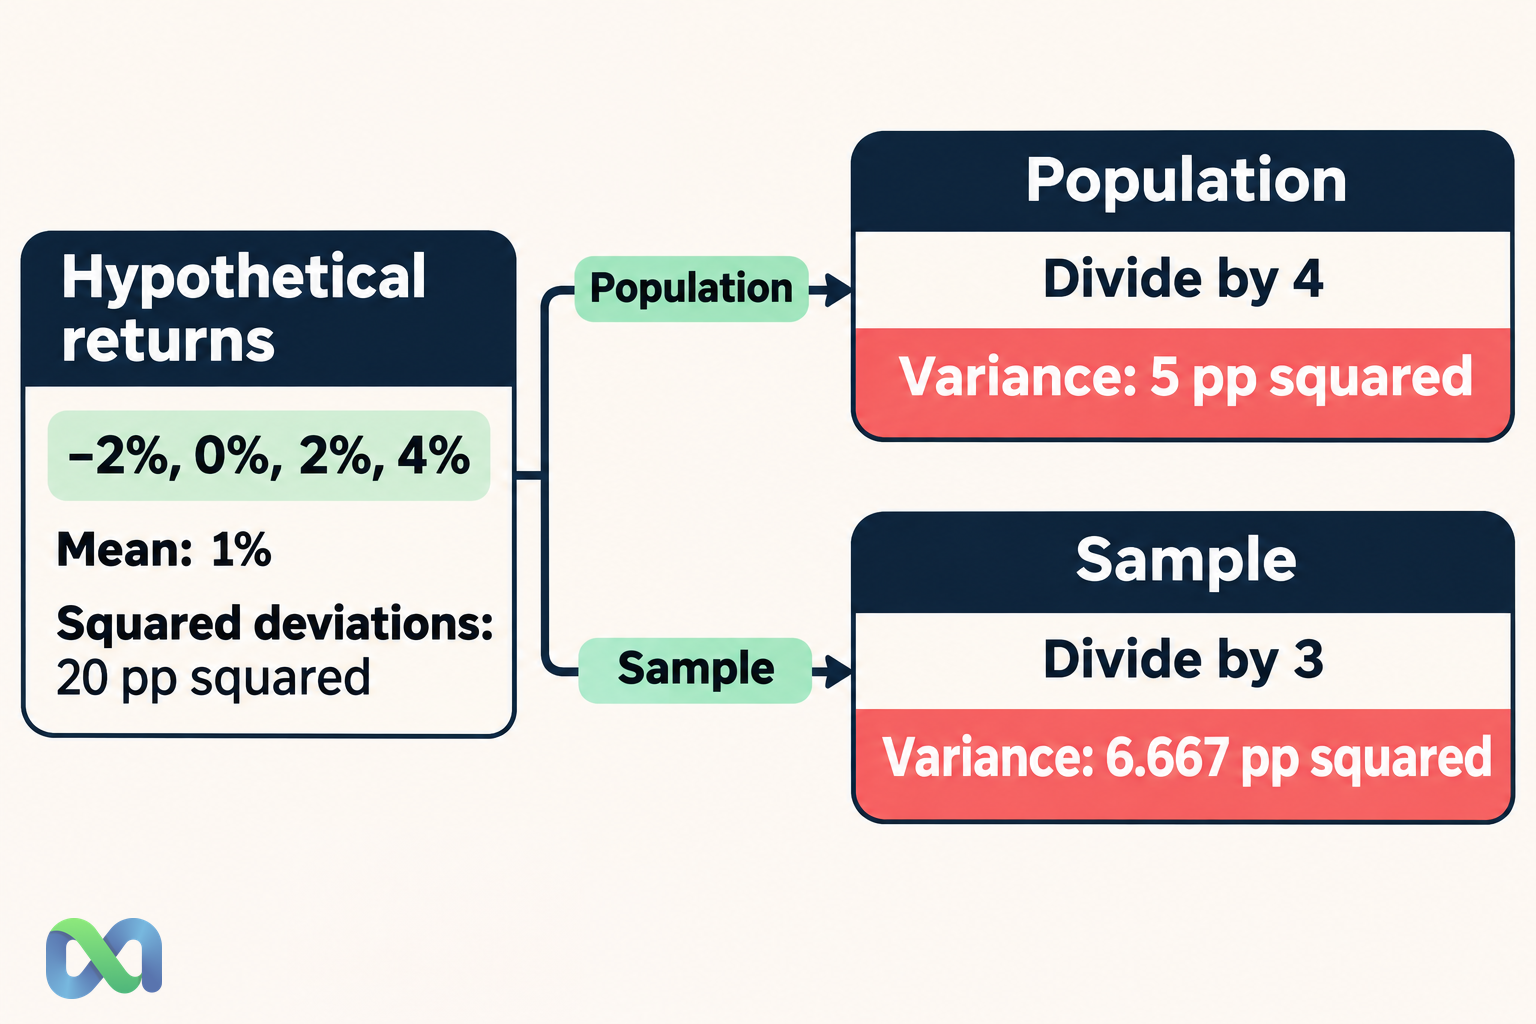
Take four hypothetical monthly returns: −2%, 0%, 2%, and 4%. Their arithmetic average is 1%.
Use percentage-point numbers in the working table. Gap means deviation from the 1% mean:
| Return | Gap | Gap² |
|---|---|---|
| −2% | −3 pp | 9 pp² |
| 0% | −1 pp | 1 pp² |
| 2% | 1 pp | 1 pp² |
| 4% | 3 pp | 9 pp² |
The squared deviations total 20 pp². “pp” means percentage points; the square indicates the calculation's squared units.
Treat the four values as the whole population
If the task is to describe these four equally weighted values as the complete population:
Population variance = 20 ÷ 4 = 5 pp²
Population standard deviation = √5 ≈ 2.236 pp
The same result applies to a hypothetical probability model assigning exactly 25% probability to each listed return. In that case the result describes the assumed distribution, not an estimated sampling process.
Treat the four values as a sample
If these are four observations used to estimate a wider return population's variance:
Sample variance = 20 ÷ 3 ≈ 6.667 pp²
Sample standard deviation = √6.667 ≈ 2.582 pp
The numerator is unchanged. Only the divisor changes. Report which convention you use rather than choosing the smaller result because it looks more favorable.
Four observations are intentionally enough to show the arithmetic clearly. They are not presented as sufficient data for a real risk estimate.
Variance Units and Standard Deviation
If the inputs are in dollars, variance is in dollars squared. If the inputs are in percentage-point numbers, variance is in percentage-points squared. That makes variance less directly intuitive than standard deviation.
Using decimal returns, the same four observations are −0.02, 0, 0.02, and 0.04. Their population variance is 0.0005, and their sample variance is approximately 0.0006667.
These are the same results expressed on a different scale. Multiplying each return by 100 multiplies variance by 100², or 10,000. Standard deviation changes by a factor of 100.
Why a variance of 5 is not a 5% volatility
In the percentage-point example, variance of 5 pp² corresponds to standard deviation of about 2.236 pp. You must take the square root and preserve the units.
Keep return units consistent across a calculation. Mixing one series as 10 and another as 0.10 can create a result that is mathematically calculated but economically meaningless.
Adding a fixed amount to every observation does not change variance, because it also shifts the mean by the same amount. Multiplying every observation by a constant a multiplies variance by a². These properties help check a spreadsheet implementation.
Portfolio Variance Includes Covariance
A portfolio's variance depends on how its components move together. For two returns combined with fixed starting weights over a common period:
Var(portfolio) = wA²Var(A) + wB²Var(B) + 2wAwBCov(A, B)
Covariance can also be written as correlation multiplied by the two standard deviations. The CFA Institute portfolio mathematics outline treats these quantities as related portfolio inputs.
Assume hypothetical 50/50 weights, standard deviations of 10% and 20% over the same horizon, and zero covariance. Using decimals:
Portfolio variance = 0.5² × 0.10² + 0.5² × 0.20² = 0.0125
Portfolio standard deviation = √0.0125 ≈ 11.18%
This differs from the 15% weighted average of the individual standard deviations. The covariance term determines how much the joint behavior changes the result.
Changing the dependence assumption
If covariance is 0.006 in decimal-return squared units, the covariance contribution becomes 2 × 0.5 × 0.5 × 0.006 = 0.003. Portfolio variance rises to 0.0155 and standard deviation rises to about 12.45%.
These inputs are assumed for illustration. Historical covariance may change, and combining positions does not automatically establish a stable diversification benefit.
For binary positions, derive the joint payoff distribution or an appropriate covariance estimate. Counting five different market names does not establish that the underlying outcomes are independent.
What Variance Misses About Financial Risk
Variance treats deviations above and below the mean symmetrically. A large positive return increases it, just as a similarly sized negative deviation does. That may not match a question focused specifically on losses.
The Sortino ratio uses downside deviation relative to a target. Conditional value at risk averages losses in a specified worst tail. These measures answer different questions and need their own definitions and assumptions.
Variance does not describe the path
Reordering the same returns leaves their variance unchanged. It can change the sequence of portfolio values and the drawdown experienced along the way.
Our maximum drawdown guide measures declines from earlier peaks. Variance alone does not report the largest drawdown, recovery time, or loss at a chosen confidence level.
For Macro Markets readers, distinguish settlement payoffs from interim valuation changes. A binary contract can have discrete settlement outcomes, while its displayed value changes along a different path. Define the series and horizon before describing its variance as risk.
Annualization needs assumptions
Multiplying a periodic variance by the number of periods follows when the aggregate is a sum of returns with the same variance and zero cross-period covariance. It is not a universal identity for compounded simple returns.
Dependence adds covariance terms. Changing volatility and overlapping observations introduce further issues. State the aggregation model rather than applying a familiar multiplier without checking the inputs.
Spreadsheet Calculation and Data Checks
In Excel, use =VAR.P(A2:A5) to describe the four values as a population. Use =VAR.S(A2:A5) for sample variance. The corresponding square roots are standard deviations.
If cells contain actual percentage values such as −2%, Excel stores −0.02. The returned variance is then in decimal-return squared units. Formatting that result as a percentage does not turn it into a standard deviation.
Check for missing periods, duplicate observations, cash flows, and changes in measurement. A constant series has variance zero. Sample variance needs at least two numeric observations and is undefined for a one-observation sample.
Document the convention, return frequency, sample period, and treatment of costs beside the result. Those details make the number interpretable and help another reader reproduce it.
Frequently Asked Questions
Can variance be negative?
The theoretical variance cannot be negative because it averages squared deviations with nonnegative weights. A negative computed value indicates a numerical, input, or implementation issue.
Should I divide by n or n − 1?
Use n when describing a complete set of equally weighted population values. Use n − 1 for the conventional sample estimator when estimating population variance from a sample. Probability-weighted scenario models use their stated probabilities instead.
Does higher variance mean a worse investment?
It means more dispersion under the specified data or model. Expected return, downside shape, liquidity, exposure size, and the investor's objective also matter. Variance alone does not rank every opportunity.
Is volatility the same as variance?
Financial volatility commonly refers to a standard deviation of returns. Variance is its square. Check the definition, horizon, and annualization convention in the particular report or model.
