


Mean, Median and Mode: Formulas and Financial Examples
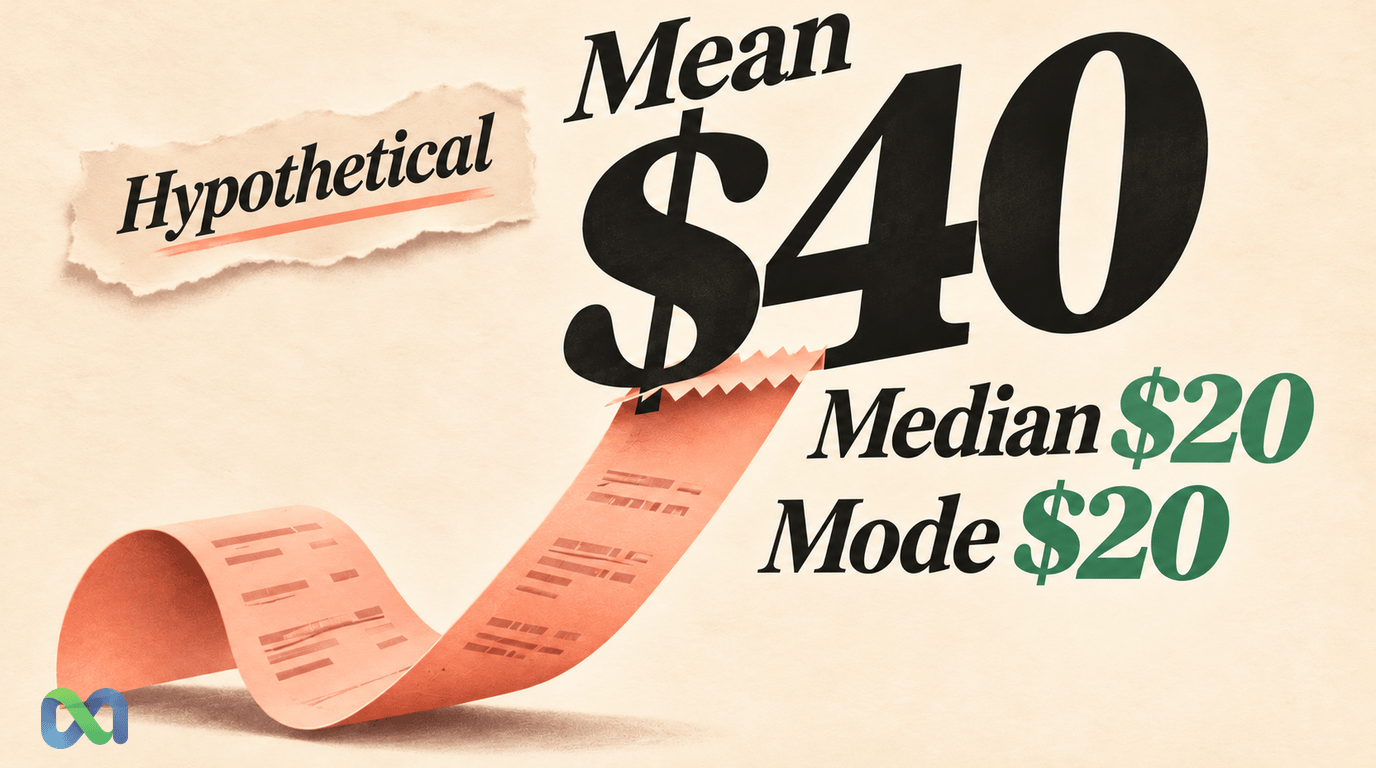
Mean, median and mode are three ways to describe the center of a data set. The mean adds every value and divides by the count. The median finds the middle of the ordered values. The mode identifies the value that appears most often.
They can give different answers without any calculation being wrong. A small number of large trades, invoices or gains can pull an average away from the experience represented by the middle data point. Choosing a useful summary starts with deciding which question the number should answer.
Mean, Median and Mode at a Glance
The arithmetic mean answers a question about the total spread evenly across data points. The median answers a question about position in an ordered set. The mode answers a question about frequency. None describes every aspect of the data.
| Measure | What it summarizes |
|---|---|
| Mean | Total divided by count |
| Median | Middle ordered value |
| Mode | Most frequent value |
For example, an operations team might need the mean payment to reconcile total cash received. It might use the median to describe a typical payment and the mode to identify an often selected payment amount. The same records can support all three questions.
The NIST guide to measures of location describes these distinct definitions of a central value. Its discussion also explains why a mode needs care when data points come from a continuous distribution. A repeated rounded amount and the peak of an underlying density are different objects.
How to Calculate Each Measure
For values x1 through xn, the arithmetic mean is:
Mean = (x1 + x2 + ... + xn) / n
Count every data point, including repeated values. Dividing by the number of distinct amounts would answer a different question. If an amount occurs several times, each occurrence contributes to the total and the count.
For the median, sort the data points from smallest to largest. With an odd count, select the central data point. With an even count, average the two central data points. Sorting changes the order, not the values being analyzed.
For the mode, count how often each value occurs. A data set can have one mode or several tied modes. When every data point has the same frequency, there is no single value that stands out as the most frequent. State that situation rather than forcing one answer.
The OpenStax treatment of central measures provides formal definitions and examples. The financial calculations below use a separate, deliberately small hypothetical data set so that every step can be inspected.
Worked Example: Five Cash Receipts
Suppose a business receives five payments, measured in dollars:
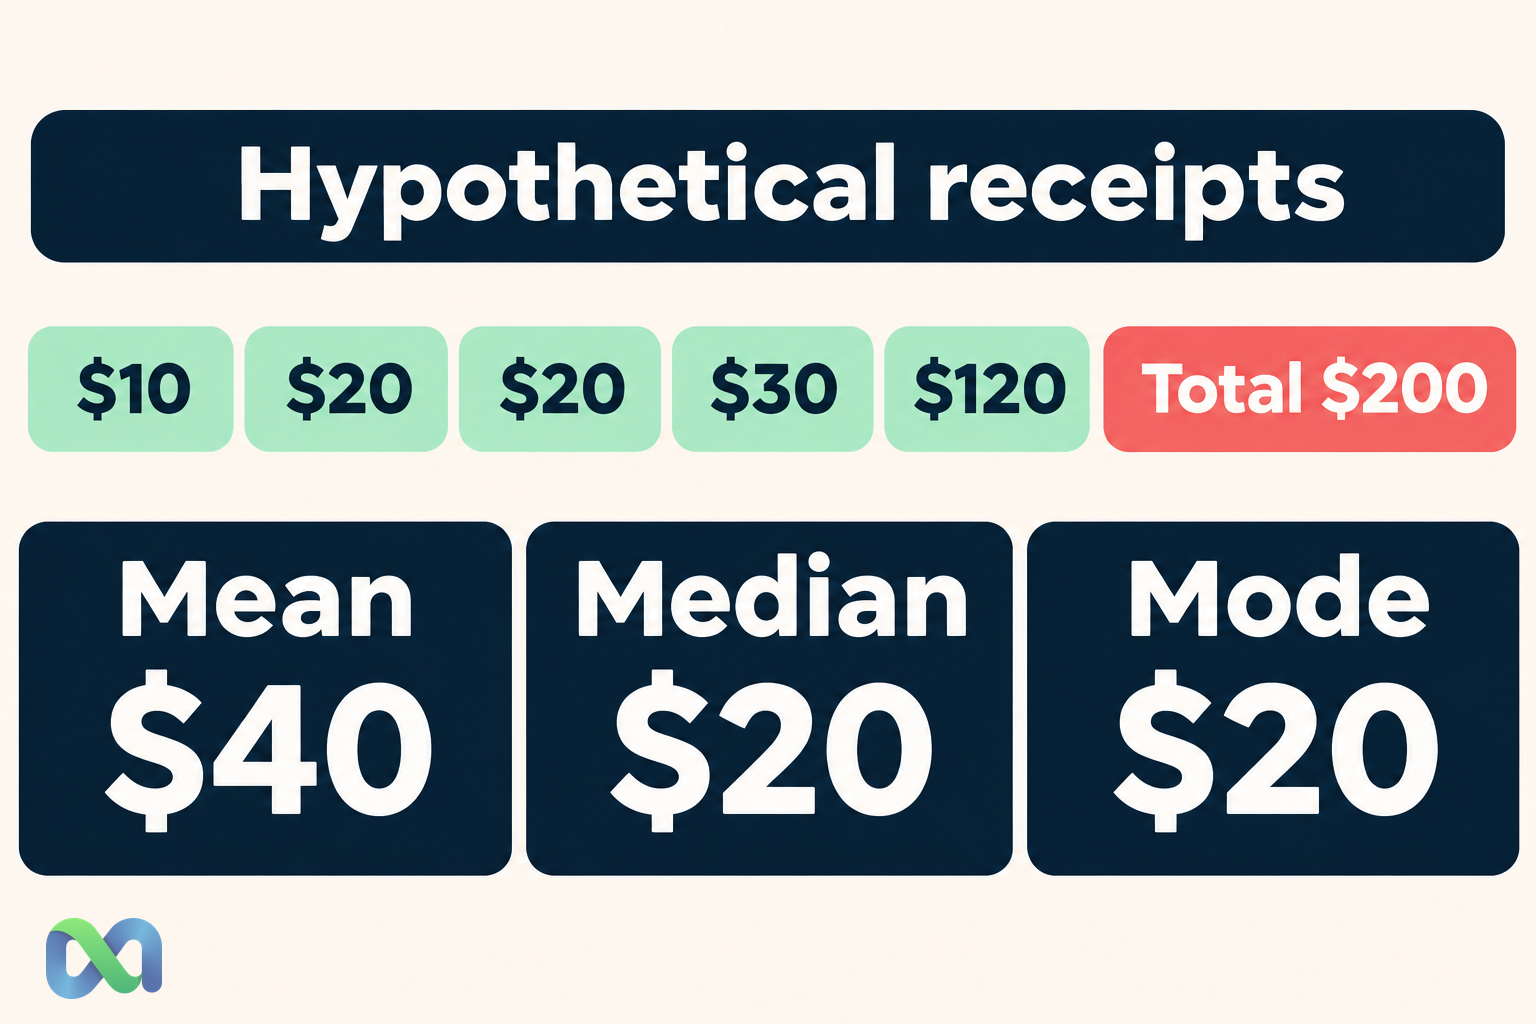
10, 20, 20, 30, 120
These are teaching inputs, not transaction records from Macro Markets. All five payments belong to the same reporting period, and each payment is one data point.
The total is $200. Divide by five to obtain a mean of $40. The sorted list already has $20 in the third position, so the median is $20. The amount $20 appears twice, while each other amount appears once, making $20 the mode.
| Measure | Result |
|---|---|
| Mean | $40 |
| Median | $20 |
| Mode | $20 |
The mean exceeds four of the five observed amounts. That does not make it incorrect. It tells us that the unusually large receipt matters a lot to the total. Describing $40 as the amount received on most payments would, however, misinterpret the calculation.
Now replace the $120 receipt with $220. The new total is $300 and the mean rises to $60. The median and mode remain $20. Only one amount changed, but it shifted the arithmetic average by $20.
This comparison shows the mechanism behind sensitivity to an extreme value. It does not show that large receipts should be removed. If the $220 payment is real and belongs in the reporting period, excluding it would make the summary incomplete. If it is a duplicate or a unit error, investigate the record before computing a revised summary.
Which Measure Should You Use?
Use the mean when the total and the number of comparable data points are central to the question. It keeps all magnitudes in the calculation. That can be valuable for budgeting, reconciliation and assessing an average modeled payoff.
Use the median when the middle of the observed distribution is the question. It can remain stable when the largest data point changes dramatically. This makes it helpful alongside the mean in a skewed data set, but it does not tell you the total cash involved.
Use the mode when repeated values are meaningful. A common ticket size or transaction category may be operationally relevant. For categorical data points, such as a payment method, the mode can be defined even though a numeric mean cannot.
The choice also depends on how the data points were recorded. If payment amounts are rounded to whole dollars, repeated values may partly reflect the recording convention. A histogram's tallest interval can move when the interval boundaries change. Explain the grouping method before interpreting a displayed peak.
It is often more informative to report two measures with their units than to argue that one is universally best. In the example, “mean $40; median $20; five receipts” tells a reader more than an unexplained “average $40.”
Weights and Returns Change the Question
A simple mean gives every data point equal weight. A weighted mean allows some data points to contribute more, using weights chosen for a stated reason:
Weighted mean = sum of (weight × value) / sum of weights
Suppose one transaction has an amount of $10 and weight 1, while another has an amount of $30 and weight 3. Their simple mean is $20. Their weighted mean is (1 × 10 + 3 × 30) / 4 = $25. Both results are valid calculations, but they represent different weighting rules.
For returns, distinguish data points across positions from returns through time. Averaging the percentage returns of equally funded positions can summarize a single-period portfolio under the stated allocation. Unequally funded positions require attention to capital weights.
Successive returns introduce compounding. A hypothetical gain of 10% followed by a loss of 10% has an arithmetic mean return of 0%. Starting from $100, the balance becomes $110 and then $99. The total compounded change is minus 1%, not zero.
This is why an arithmetic average is not by itself a growth rate. A geometric calculation addresses compounded growth across periods, while the arithmetic mean summarizes the period returns. Identify the objective before choosing the calculation.
The expected value formula introduces another weighting scheme: outcomes weighted by their modeled probabilities. A historical average and a probability-weighted forecast need not be the same number.
Center Does Not Describe the Whole Distribution
Two data sets can share a mean and have different spreads. Their largest possible losses, concentration and frequency of extreme data points can also differ. A central value cannot show that two financial exposures carry the same risk.
Read the center alongside the standard deviation or another suitable measure of dispersion. The variance guide explains why squared distances from the mean capture a different feature of the data.
A median does not solve every problem with a small or biased sample either. If only successful transactions were retained, computing their median extra carefully would not recover the missing data points. Collection, inclusion rules and measurement quality still matter.
Likewise, a forecast distribution's mean is not necessarily its most likely realized outcome. A discrete probability distribution can have an expected value that is not among its possible outcomes. Report the distinction rather than describing the average as a prediction that must occur.
A Practical Reporting Routine
Start by writing what one data point represents: a payment, a position, a day or a customer. Mixing these units can produce a plausible-looking number with little meaning. Record the time period and any weights as well.
Next, sort or inspect the raw data points. Check missing values, duplicates and units. Zero and missing are different: a zero-dollar receipt is an observed amount, while an absent record is an information gap. Decide which belongs in the calculation using the reporting question.
Compute the measures that answer that question, then compare them. A large difference between mean and median invites inspection of the distribution; it is not by itself evidence of fraud or an error. Report sample size and spread so that readers can judge how much information the summary compresses.
Finally, label the result precisely. “Median receipt in dollars” is more useful than an unlabeled average. Retain enough detail for another person to reproduce the calculation from the same included records.
Frequently Asked Questions
Can the mean be a value that never appears in the data?
Yes. The mean of $10 and $30 is $20 even though neither data point equals $20. It is a calculation from the total and count, not a requirement that one actual data point match it.
Is the median always better when money is involved?
No. It answers a different question. The median can describe the middle data point, while the mean remains useful when the total per data point matters. State the reporting purpose and consider showing both.
Can a data set have more than one mode?
Yes. If several values tie for the greatest frequency, report the tied values and their frequencies. With continuous measurements, explain whether you are discussing exact recorded values or a grouped distribution.
Do these measures tell me whether a trade has an advantage?
No. They summarize data points or a stated model. A trading decision also depends on execution price, costs, outcome rules, uncertainty and the reliability of the underlying estimates. A high historical average alone does not show a future advantage.
