


Null Hypothesis: Meaning, Examples and How to Test It
A null hypothesis is a precise baseline claim about a population, process or statistical model that a test evaluates using data. An alternative hypothesis states the departure from that baseline that the test is designed to detect.
The null is not by itself a claim that nothing matters. It might state a probability, equal population means or no association between two variables. A useful null turns a practical question into a statement that can generate testable predictions.
Null and Alternative Hypotheses
The labels H0 and H1, or H0 and Ha, distinguish the two claims. The parameter in the statement belongs to a population or model. It is not the sample estimate that has already been observed.
If p represents a method's success probability, a simple setup is H0: p = 0.50 versus H1: p > 0.50. The test asks whether the data provide evidence against that baseline in the stated direction.
The OpenStax discussion of null and alternative hypotheses distinguishes rejecting the null from failing to reject it. Both are decisions made under a procedure; neither gives direct certainty about the underlying claim.
| Element | Example |
|---|---|
| Parameter | Success probability p |
| Null | p = 0.50 |
| Alternative | p > 0.50 |
In another study the baseline could be p = 0.70. A binary outcome alone does not make 50% the right benchmark. Choose the baseline from the actual question and the information available before observing the review sample.
Write the Question Before the Test
Start with a clearly defined outcome. “A forecast was correct” needs a resolution rule, a horizon and a treatment for unresolved cases. Different definitions can produce different samples even when the forecasting method is unchanged.
Next identify the population or repeated process to which the claim refers. A test of a stable probability assumes more structure than a collection of unrelated wins and losses. Explain why the data points can reasonably be analyzed together.
Then choose the alternative. A one-sided alternative asks about a stated direction, such as a probability above the baseline. A two-sided alternative allows departures in either direction. Choosing the direction after looking at the results changes the testing procedure.
Finally, state the test and decision rule. A significance level such as 0.05 is a feature of that rule, not a probability discovered in the sample. Set it alongside the design rather than treating it as a button that validates a preferred conclusion.
Worked Example: Sixteen Successes in Twenty Cases
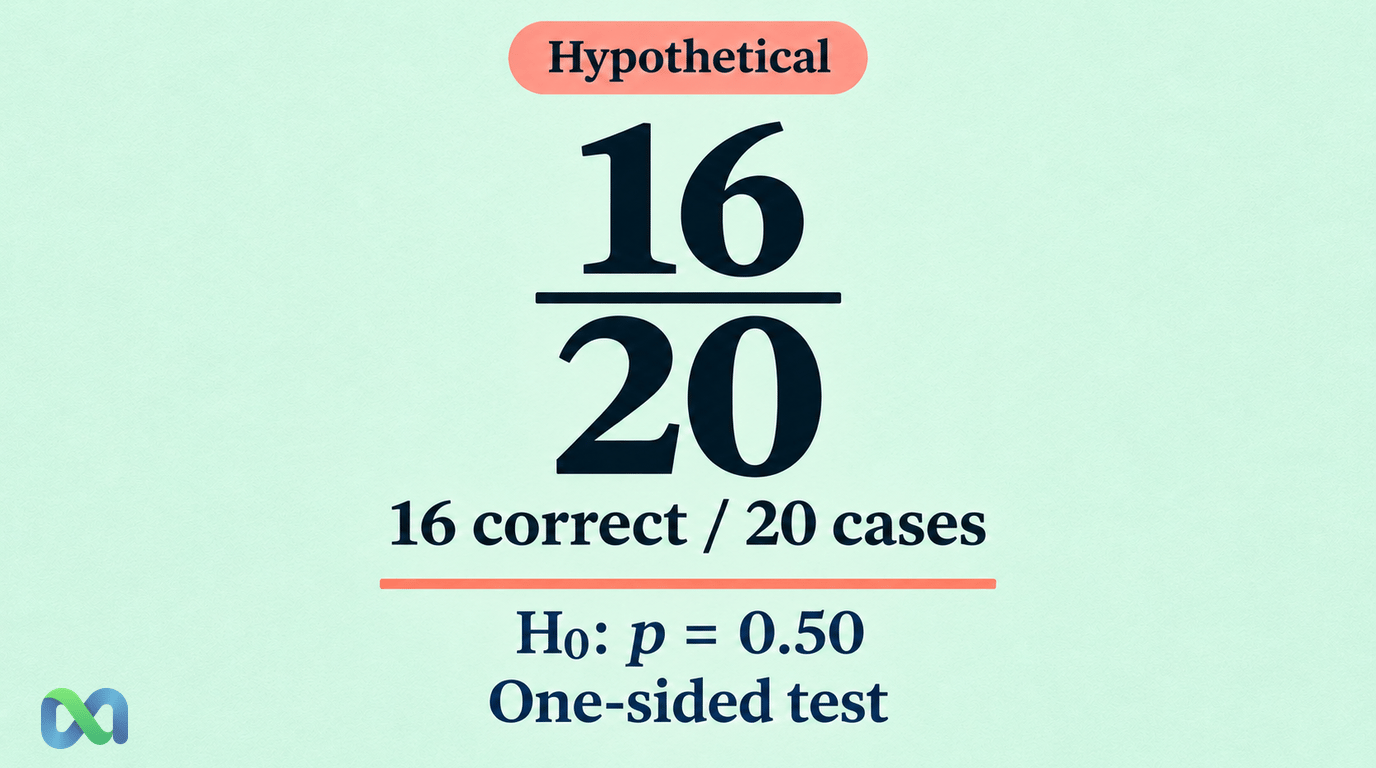
Suppose a hypothetical forecasting exercise contains 20 independent cases. Define success in advance and assume that, under H0, each case has the same success probability of 0.50. The method records 16 successes.
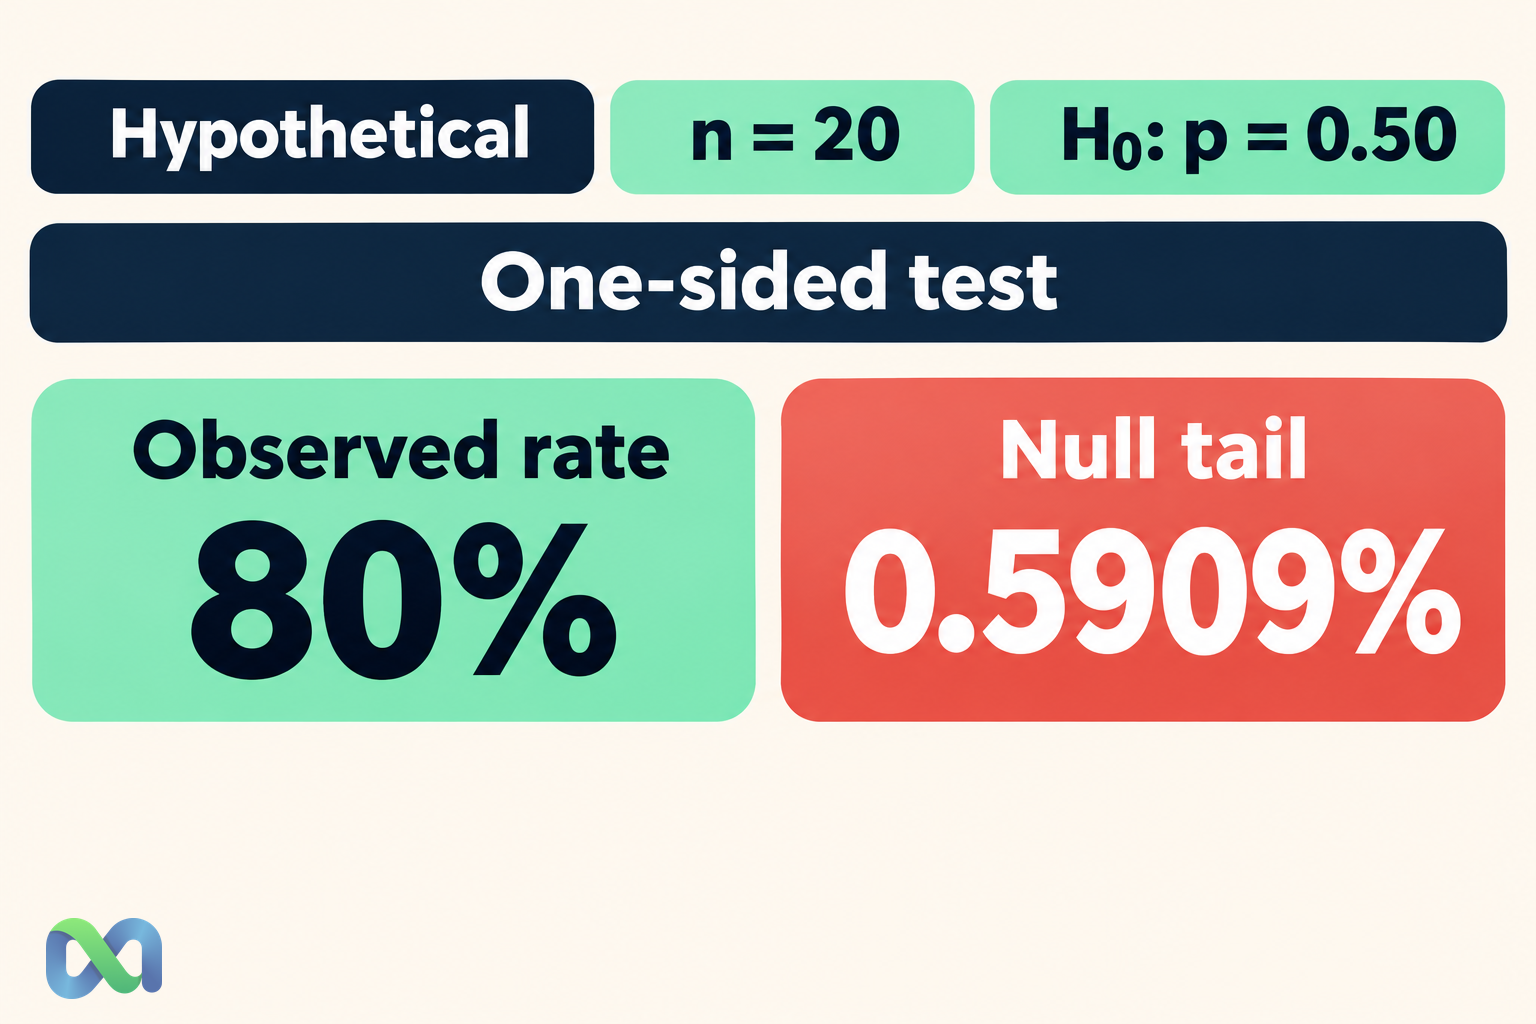
The observed success rate is 16 / 20 = 80%. That descriptive rate is not the p value. To assess H0 against the preselected alternative p > 0.50, compute the probability of at least 16 successes under the null model.
Let X count the successes. Under the stated assumptions, X follows a binomial distribution with n = 20 and p = 0.50:
p value = P(X ≥ 16 | n = 20, p = 0.50)
The relevant success counts are 16, 17, 18, 19 and 20. Their binomial coefficients add to:
4,845 + 1,140 + 190 + 20 + 1 = 6,196
There are 2²⁰ = 1,048,576 equally likely binary sequences under this null. Therefore:
p value = 6,196 / 1,048,576 ≈ 0.005909
That is about 0.5909%. It is the probability of this success count or a higher one under the stated null process, not the probability that H0 is true.
At a preselected 0.05 significance level, this procedure rejects H0. It does not prove that the method's true success probability is exactly 80%, that the assumptions hold or that the method will produce profitable trades.
Our binomial-distribution guide explains the count model. The P Value guide focuses on interpreting the tail probability rather than on formulating the baseline question.
Reproduce the Calculation
The SciPy binomtest documentation describes exact binomial testing and its alternative settings. The calculation above can be reproduced with:
from scipy.stats import binomtest

result = binomtest(16, 20, p=0.50, alternative="greater")
print(result.pvalue)
This code implements the declared one-sided question. Changing the alternative to a two-sided question changes which outcomes count as evidence against the baseline. Record the chosen procedure and its assumptions along with the numeric answer.
The arithmetic can also be checked independently by counting all binary sequences with at least 16 successes. Both routes produce the same numerator of 6,196. Agreement verifies the calculation for this model; it does not verify that real forecast cases are independent or have a common probability.
Rejecting and Failing to Reject Are Different Decisions
Rejecting H0 means the observed result falls in the procedure's rejection region. It is evidence against the null under the stated assumptions. It does not assign probabilities to all competing explanations.
Failing to reject H0 means the data did not provide enough evidence for rejection under that procedure. It does not show equality or prove that an effect is too small to matter. A small sample or noisy measurement can leave a great deal of uncertainty.
If the practical question is whether a difference is small enough to treat as equivalent, design an equivalence assessment with a justified tolerance. Simply failing to reject a difference does not answer that question.
The American Statistical Association's statement on p values emphasizes the need to consider design, assumptions and context. A threshold decision should not substitute for a substantive explanation of what the evidence supports.
Errors, Sample Size and Repeated Testing
A Type I error occurs when a procedure rejects a true null. A Type II error occurs when it fails to reject a false null. The probability of detecting a stated departure is called power. These are properties evaluated under specific models and designs.
The significance level does not mean that a reported conclusion has that probability of being wrong. Nor does it show the false-discovery rate among a collection of selected results. Those are different quantities with different information requirements.
Repeated searches make results harder to read. Trying many variants, horizons or filters and reporting only the smallest p value introduces selection that the isolated test does not describe. State what was tried and use a procedure suitable for the testing family.
More data points can improve precision when they provide relevant information under suitable assumptions. Adding dependent or poorly measured rows is not the same as adding independent evidence. The law of large numbers also requires attention to the process generating the data points.
Apply the Result to the Actual Decision
Statistical evidence about a forecasting method is not a payoff analysis. A high success rate can coincide with losses when positions are expensive, costs are large or mistakes have large effects. Keep the statistical outcome separate from the financial claim.
Report the estimate and uncertainty alongside the test. A confidence interval can help describe a range of parameter values compatible with an interval procedure. Its construction and interpretation still depend on assumptions.
Also ask whether the evaluated cases represent the setting in which the method will be used. A carefully computed test on a selected historical sample can answer a narrow historical question without showing performance in another regime.
Write a conclusion that preserves those limits. For the worked example, a suitable statement identifies the assumed independent binomial process, the preselected one-sided alternative and the evidence against p = 0.50. It should not turn the result into proof of future returns.
Frequently Asked Questions
Is the null hypothesis always no effect?
No. It can state a specific parameter value or another model restriction. “No effect” and “no association” are common baselines, but the precise null must match the question being tested.
Does a small p value tell me the probability that H0 is true?
No. A p value is computed under H0 and other assumptions. Assigning a probability to a hypothesis requires an extra inferential framework and inputs beyond the tail probability.
Can I choose a one-sided test after seeing a favorable result?
Doing so changes the selection process and makes the isolated preplanned-test interpretation inappropriate. Decide the direction in advance or account for the selection when assessing the evidence.
Does failure to reject mean the method has no value?
No. It means the procedure did not reject the stated baseline with the available data. Practical value, uncertainty, effect size and the effects of decisions require separate consideration.
