


Risk Aversion: Meaning, Examples and Risk Preferences

Risk aversion means favoring a sure amount over a risky choice with the same expected cash value. Under expected utility, a person cares about the possible wealth outcomes as well as their average.
A risk-averse person can still take risk. The possible gain may be large enough for their needs and tastes. The key is that the average cash payoff and its value to a person are two different things.
Risk Aversion, Neutrality and Risk Seeking
In this model, a risk-neutral person values a cash lottery and its average cash payoff received for sure equally. A risk-averse person prefers or is indifferent to the sure amount. A risk-seeking person favors the lottery at the same cash average.
Those labels describe choices with stated outcomes and chances. One action alone cannot tell us which label fits. First ask what the person knew, what else they could choose and what each outcome would mean for them.
The MIT notes on attitudes toward risk connect expected utility, concavity and certainty equivalents. The following example uses a small hypothetical wealth lottery to make those relationships explicit.
| Preference | Same expected money |
|---|---|
| Risk averse | Prefers certainty |
| Risk neutral | Indifferent |
| Risk seeking | Prefers the lottery |
The comparison holds the expected cash value fixed. Preferring a larger sure amount to much less cash at risk would not, by itself, reveal a person's attitude toward risk.
Expected Value and Expected Utility
Expected cash value weights each cash outcome by its chance. Expected utility applies a utility function to each wealth outcome first, then weights those utility values by the chances.
Expected wealth = sum of (probability × wealth)
Expected utility = sum of [probability × utility(wealth)]
A utility function represents preferences in the model. Its numeric units are not dollars, and averaging utilities is not the same operation as taking utility of average wealth.
An increasing, concave utility function gives more wealth a higher value, but each extra dollar adds less than the last. In the expected-utility model, that shape leads to risk aversion. A straight-line utility function gives risk neutrality for cash lotteries.
The MIT microeconomics lecture summaries discuss this distinction between expected money and expected utility. A specific utility function in a teaching example is an assumption, not a measured description of every reader's preferences.
Worked Example: Wealth of $64 or $144
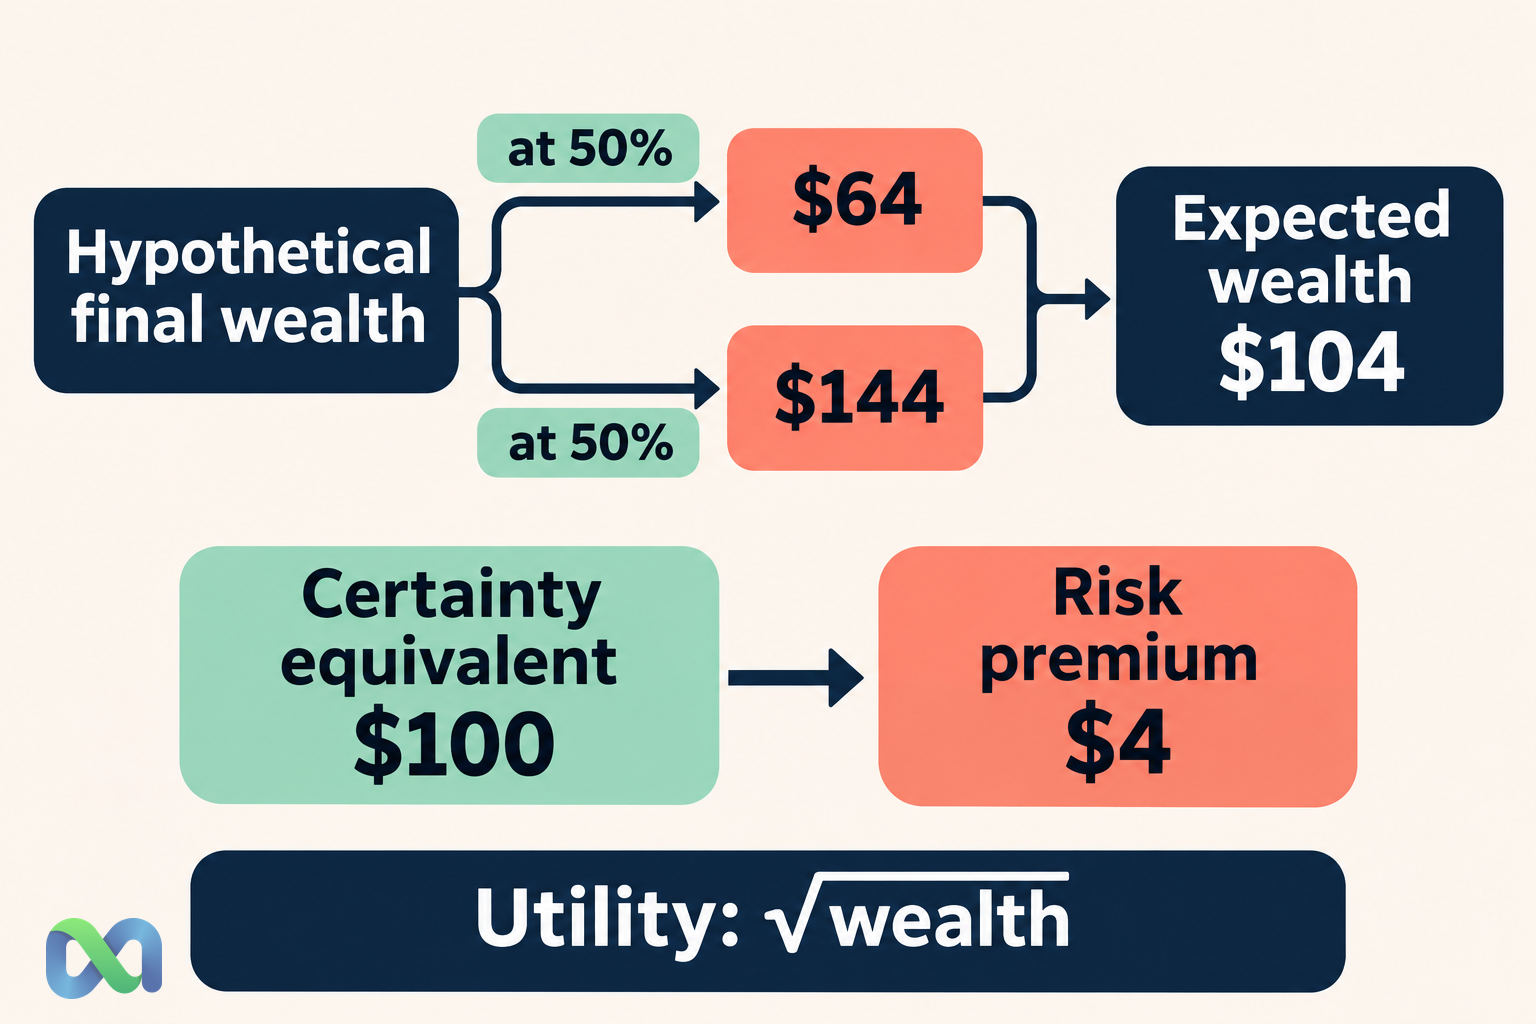
Start with a hypothetical wealth level of $100. An offer leads to final wealth of $64 with probability 50% or $144 with probability 50%. The matching gains are minus $36 and plus $44.
Expected final wealth is:
0.50 × $64 + 0.50 × $144 = $104
The expected gain relative to the starting $100 is $4. That is a modeled average across outcomes, not a sure gain on one realization.
Now assume utility is the square root of final wealth, u(W) = √W. The two possible utility values are 8 and 12. Expected utility is thus:
0.50 × 8 + 0.50 × 12 = 10
A sure final wealth of $100 also has utility √100 = 10. Under this stated preference model, the person is indifferent between the lottery and $100 received for sure.
| Quantity | Result |
|---|---|
| Expected wealth | $104 |
| Expected utility | 10 |
| Certainty equivalent | $100 |
The person would prefer $104 for certain to the lottery, because √104 is greater than 10. A positive expected gain can thus coexist with a preference for keeping the initial $100 rather than taking this specific offer.
The calculation does not show that the offer is unsuitable for everyone. It shows why a decision rule based only on expected money can differ from a decision rule using a stated concave utility function.
Certainty Equivalent and Risk Premium
The certainty equivalent is the sure wealth amount that a person values just as much as the lottery. To find it, work backward from expected utility with the inverse utility function.
Certainty equivalent = inverse utility(expected utility)
For square-root utility, the inverse squares the utility value. The example's certainty equivalent is 10² = $100.
The decision-theory risk premium is expected wealth minus the certainty equivalent:
Risk premium = $104 − $100 = $4
Here it describes the gap between the lottery's average wealth and its certainty equivalent under the assumed preferences. It is not by itself an insurance price, a quoted market premium or the extra return every investor would require.
For a risk-neutral person with utility u(W) = W, the same lottery has a certainty equivalent of $104. The outcomes and chances have not changed; the preference model has. Different assumptions about utility can thus change a decision without changing the expected-money arithmetic.
Our expected-value guide explains the cash calculation separately. Keeping the two concepts distinct helps avoid describing every positive modeled expected value as an obligation to take a risk.
Risk Preference Is Different from Risk Capacity
Risk preference concerns how a person values uncertain outcomes. Risk capacity asks what losses their funds, bills and deadlines let them bear. Someone who feels at ease with risk may still have a bill that makes a large loss too costly.
Beliefs are a separate input. Two people may choose differently because they give the outcomes different chances, even if their tastes are the same. That is a disagreement about the forecast, so calling one person more risk averse would miss the cause.
A clear 50/50 lottery in a teaching example differs from a real offer with unclear chances, costs or settlement rules. Source quality still matters. A neat model should not hide gaps in what is known.
These distinctions help us ask clearer questions. They do not tell us which risks suit an individual reader. The example assumes its chances, final wealth and utility; it does not measure a person's tastes from their choices.
Position Size Changes the Exposure
The same offer can change a person's possible wealth in different ways at different position sizes. A small stake and a large stake need not be the same choice, even when their quoted terms match.
Judge losses against the funds and bills that remain. Include every payoff, the timing and all costs in the choice. Leaving out a loss can make a risky offer look better under almost any preference model.
The risk-reward ratio guide compares payoff magnitudes, while the Kelly criterion guide examines a specific growth-oriented sizing framework. Neither determines everyone's utility function or removes uncertainty from the input estimates.
Changing an assumed chance can also alter the modeled preference between alternatives. A sensitivity analysis helps show which conclusions depend on uncertain inputs instead of presenting one point estimate as decisive.
When reading a survey about risk, look at what the choices hold fixed. Do the two choices have the same average cash payoff? Do both include all costs? Does the person know the stated chances, or have to guess them? These details can change what a choice tells us.
Also ask what the person owns outside the example. A loss on one position may arrive at the same time as a loss elsewhere. Cash needed for a bill due soon is not the same as cash that can remain at risk for years. The simple lottery leaves those links out, so it should prompt questions rather than supply a rule for every stake.
Use the Model to Ask Better Questions
Start with what is left at the end in each case. Are the chances known, estimated or made up for the example? Are fees and other costs included? Could a delay or unresolved outcome change the choice?
Then separate the questions. Expected value describes modeled money. Expected utility adds the person's tastes. Their funds and bills affect what losses they can bear. The choice may depend on all of these, rather than one ratio.
To use a certainty equivalent, state the utility function and where it applies. Square-root utility needs wealth at or above zero. A different function, or more features of the outcome, can change the result.
Finally, avoid using a teaching model to label a person. Their choice can reflect beliefs, limits, habits or effects the model left out. A sound reading needs more evidence than whether they took one gamble.
Frequently Asked Questions
Does risk aversion mean avoiding all risk?
No. It describes a preference in a controlled comparison. A risk-averse person can take risk when the modeled compensation and circumstances justify it under their preferences.
Can a positive expected-value opportunity be rejected rationally?
Yes within a suitable preference model. In the example, the lottery has expected wealth of $104 but a certainty equivalent of $100 under square-root utility.
Is the certainty equivalent the most likely outcome?
No. It is a sure amount with the same utility as the lottery under the stated model. It need not equal either possible outcome or the expected wealth.
Can I infer risk aversion from two people choosing differently?
Not without examining their information, beliefs, constraints and other options. Different chance estimates or obligations can explain different choices even with similar preferences.
