


Survivorship Bias: Examples in Trading and Investing

Survivorship bias occurs when an analysis includes the people, firms, funds or strategies that remain visible while omitting those that disappeared or failed. The surviving sample can then give a misleading account of the original group.
In financial research, the problem often begins with a convenient present-day list. Looking backward at today's successful participants can exclude losses, closures and other outcomes that a decision-maker could not have known to avoid at the starting date.
Why the Missing Cases Matter
A performance average depends on which data points enter it. If weak performers are more likely to disappear from the database, the surviving records may overrepresent better outcomes. The arithmetic on those records can be correct while the conclusion about the original population is wrong.
Disappearance does not always mean failure. A fund may merge, a business may be acquired or a trader may stop for reasons unrelated to performance. That is why a useful analysis needs the reason for exit and a defensible treatment of the associated value.
Research on mutual fund survivorship examines how survival rules affect measured performance and distinguishes survivor selection from look-ahead selection. The lesson for a new analysis is to inspect how the sample was formed, rather than assuming a list of surviving records represents every opportunity available earlier.
The direction and size of bias depend on that formation process. It is reasonable to investigate whether omitted losses inflate a performance record. It is not reasonable to apply a universal correction percentage to every database without examining its records.
Worked Example: The Survivors Gain, the Cohort Loses
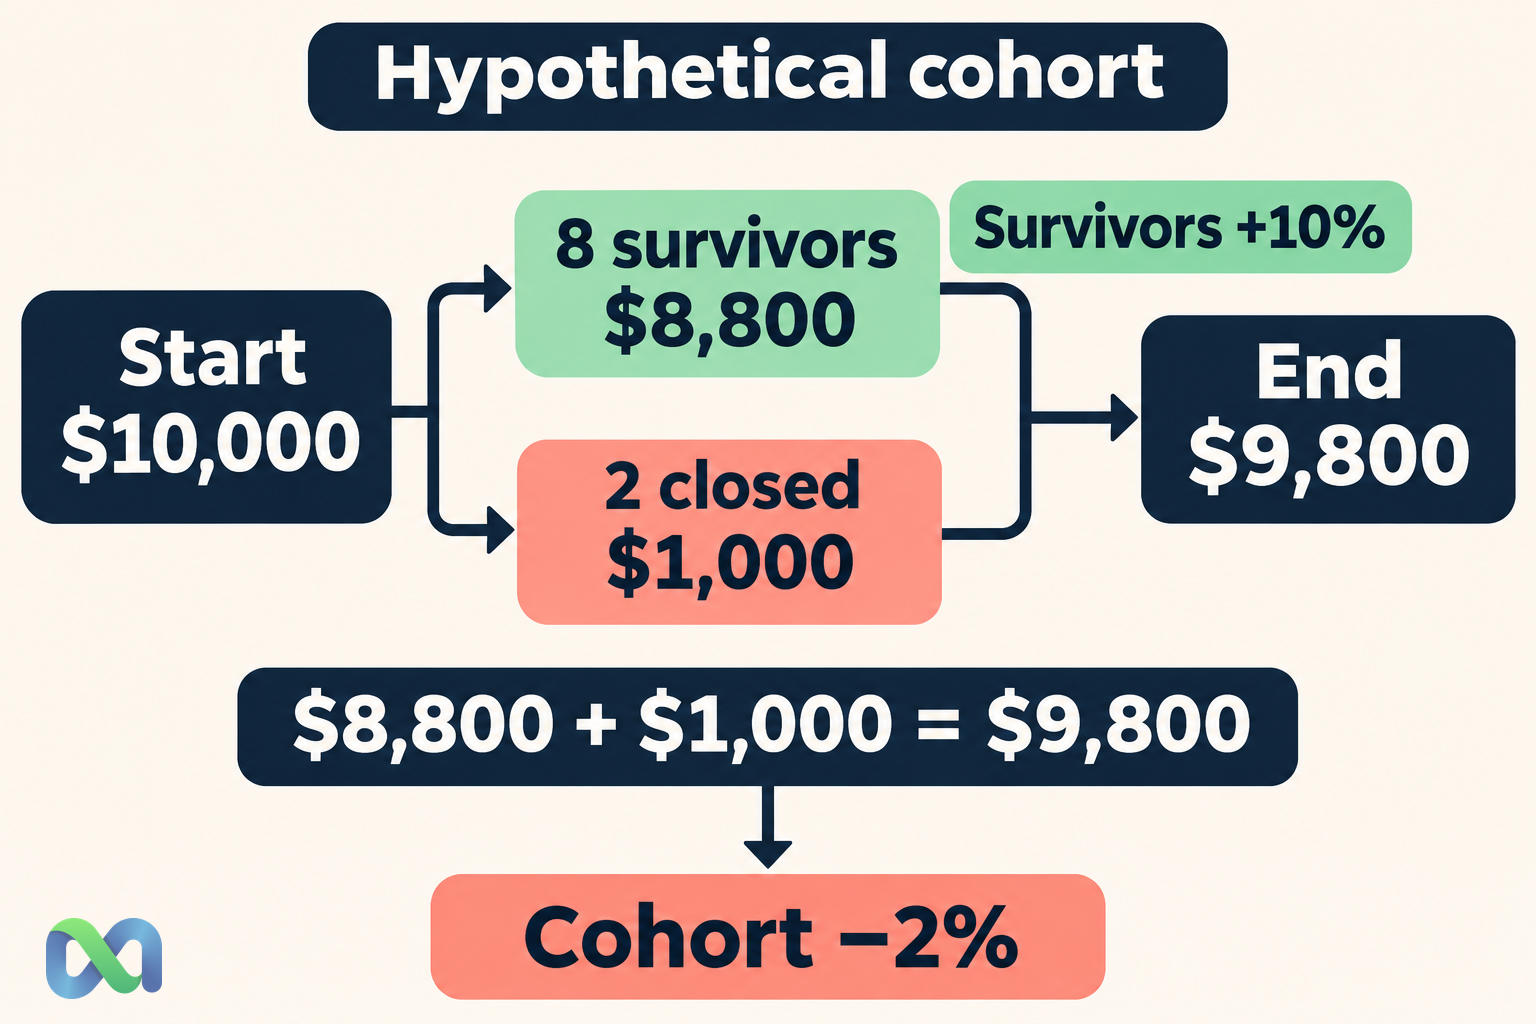
Consider ten hypothetical portfolios, each beginning with $1,000. They are followed over the same review period. Eight finish at $1,100 each. Two close at $500 each, and those proceeds are held unchanged until the common end date.
Assume no external cash flows or fees. The example isolates sample selection; it is not a record of actual funds or trading accounts.
The eight continuing portfolios each gained 10%. A report that includes only those survivors shows a 10% average return. But the original group invested $10,000, and its ending value is:
8 × $1,100 + 2 × $500 = $9,800
Whole-cohort return = ($9,800 − $10,000) / $10,000 = −2%
| Included group | Ending value |
|---|---|
| Eight survivors | $8,800 |
| Two closed portfolios | $1,000 |
| Original cohort | $9,800 |
The difference between the survivor-only average of 10% and the cohort result of minus 2% is 12 percentage points. With equal initial capital and the stated assumptions, the average of all ten individual returns also equals minus 2%.
This is not a dispute over how to compute a percentage. It is a dispute over which experiences belong in the report. The survivor-only figure describes the retained eight portfolios. It does not describe what happened to the original ten.
Do Not Turn Every Closure into a Total Loss
Replacing a missing record with zero ending value can be as misleading as dropping it. In the example, the closed portfolios retained $500 each. Treating them as worthless would invent an extra loss that the stated data do not contain.
For an acquisition, merger or liquidation, trace what the investor actually received and when. Cash proceeds, exchange ratios and later holding assumptions can affect the result. A name disappearing from a list is not enough information to compute its return.
The review horizon also matters. If some portfolios exit early, decide how proceeds are treated for the rest of the period. Holding cash unchanged was an explicit simplifying assumption in the example, not a claim that cash always earns zero.
When the necessary exit data cannot be recovered, describe the gap. A sensitivity analysis using stated alternative treatments can show how much the conclusion depends on missing records. It should not disguise an assumed outcome as observed history.
Survivorship Bias in a Backtest
Suppose a strategy is evaluated using the current members of an index throughout an earlier period. The test may omit companies that were once constituents but later left. A historical investor did not have today's membership list available in advance.
The remedy starts with point-in-time data: which securities or opportunities were eligible at each historical date? Inclusion rules, corporate actions, exits and availability dates should reflect information available then.
A database that contains delisted securities is helpful, but it does not by itself make a backtest free of selection problems. The analyst can still select strategies after seeing their results, discard incomplete histories or use revisions that were published later.
Record the investment universe and the rule for joining or leaving it. Keep the initial cohort when the question concerns what happened to starting participants. For a changing-universe strategy, document the eligibility rule and timing rather than silently substituting one fixed list.
These choices can also affect risk estimates. A sample missing severe failures may make variability or drawdowns look smaller. A polished Sharpe ratio or Sortino ratio cannot repair a performance series that excludes relevant outcomes.
Survivorship, Look-Ahead and Regression to the Mean
Survivorship bias is a form of selection tied to remaining in the observed sample. Look-ahead bias uses information that would not have been available when the historical decision was made. A present-day survivor list used in an earlier backtest can involve both problems.
Selection can happen without anyone disappearing. Testing many strategies and publicizing only the best historical result creates another form of selective evidence. It needs a review procedure that reflects how the strategy was chosen.
Regression to the mean is different. An extreme measurement may be followed by a less extreme one when repeated measurements are imperfectly correlated. That can occur even when every participant remains in the sample.
The two mechanisms can coexist. A researcher might select extreme winners, omit failed participants and then read later changes in performance. Identifying one mechanism does not show that the others are absent.
Use specific language in the diagnosis. “The sample excludes two liquidated portfolios” is more informative than attaching a broad bias label without showing which records were lost and how their inclusion changes the answer.
A Better Way to Review Performance Claims
First ask who was eligible at the beginning and how that set was recorded. A current leaderboard answers a question about visible participants now. It does not by itself provide the full outcome history of all earlier participants.
Next ask whether unsuccessful or inactive cases remain accessible. Check how the report treats closures, unresolved outcomes, account changes and missing histories. The handling should match the claimed population and review period.
Then examine capital weights and cash flows. The equal-weight calculation in the example works because every portfolio starts with the same amount. If initial allocations differ, an equal average of returns and the combined capital result can differ even with a complete sample.
Finally, distinguish descriptive results from a future decision rule. Reconstructing a complete historical cohort improves the historical description. It does not show that future outcomes will follow the same distribution or that a strategy can be executed at the assumed prices and costs.
The expected-value guide explains another important distinction: a realized historical average and a forward-looking probability-weighted payoff are different quantities. Neither should be substituted for the other without a model connecting them.
What to Report When Data Are Incomplete
State the number of starting records, the number retained and the reason for each material exclusion. If the starting set itself is unknown, say so. A retention percentage computed from an incomplete denominator may give a false sense of completeness.
Present the survivor-only result with an accurate label. If an all-cohort result is available, show it beside the retained-sample result and explain the different questions. Avoid presenting a selected result as an industry-wide experience.
Where assumptions are unavoidable, make them visible next to the affected conclusion. The worked example explicitly retains liquidation proceeds and fixes the ending date. A real study should document its own choices with the same clarity.
This approach gives readers a way to judge the claim. It also makes later corrections easier: new exit records can be added to a known framework instead of forcing a reconstruction of an undocumented sample.
Frequently Asked Questions
Are all surviving firms or funds successful?
No. Survival and performance are different measurements. The bias depends on whether the observed sample and its selection process support the conclusion being drawn.
Should I assign a total loss to every missing fund?
No. Find the actual proceeds or other economic outcome. Missing information should be disclosed or modeled as an explicit assumption, not replaced with an invented loss.
Does including delisted securities solve every backtesting problem?
No. Timing, strategy selection, revised information, costs and execution assumptions can introduce other errors. A more complete universe addresses one important part of the problem.
Can survivor-only performance still be useful?
Yes, if the question genuinely concerns those survivors and the sample is labeled accurately. The problem is extending that selected experience to the original cohort or to future entrants without justification.
